
The Top 3 Indicators to Improve Your Trading

Reading Time: 6 Minutes
There are always new tools and methods that traders are looking for to improve their skills and help them make better decisions.
Irrespective of whether you’re a day trader, a scalper, a swing trader or even a position trader, or whether you are trading Digital Currencies, Forex or Stocks, the importance of reliable indicators cannot be overstated. These tools provide important information about price movement, market trends, and potential reversals.
Moving Averages
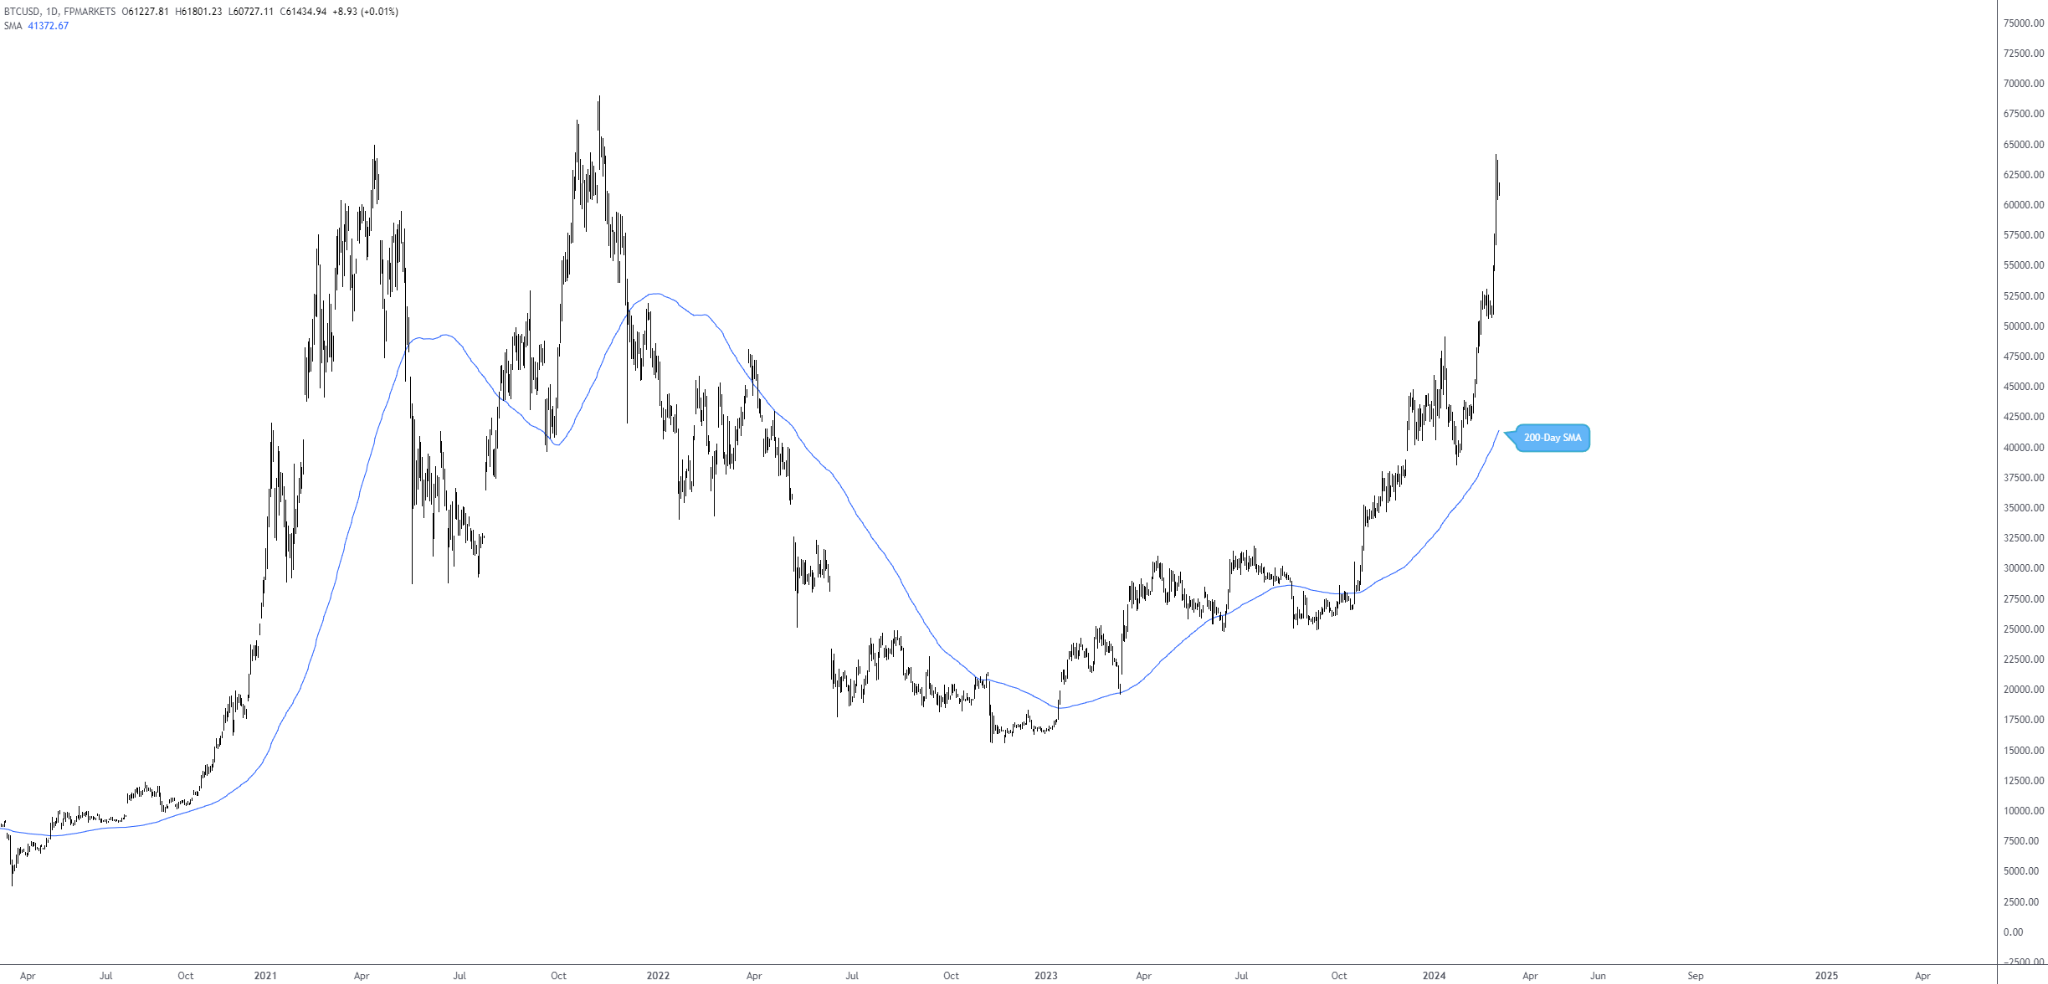
First on the list stands one of the most widely used and popular technical Indicators, the Moving Average (MA). The job of a MA is to essentially filter price action in the shape of a single continuous line, making it easier to identify trend direction.
A Moving Average calculates a security's average price over a certain period (how long can be defined by the user), giving an average price that is always up to date. Although there exists a number of different Moving Averages, there are two that remain popular:
- Simple Moving Average (SMA): The SMA calculates the average price (usually using closing prices) of an asset over a specific number of days, assigning equal weight to all prices in the series.
- Exponential Moving Average (EMA): The EMA (again, usually using closing prices) gives more weight to recent prices, responding more quickly to price changes than the SMA.
Why Moving Averages?
- Trend Identification: If the price is above the MA, it's an uptrend. If it's below, it’s a downtrend. Traders also use the direction that the MA is pointing in for trend identification, as well as crossovers for buy and sell signals (short-term MA crossing above a long-term MA is a bullish trend reversal buy signal, for example).
- Support and Resistance Levels: Moving Averages can act as dynamic support and resistance levels. In an uptrend, the MA can serve as support, while in a downtrend, it can act as resistance.
Relative Strength Index
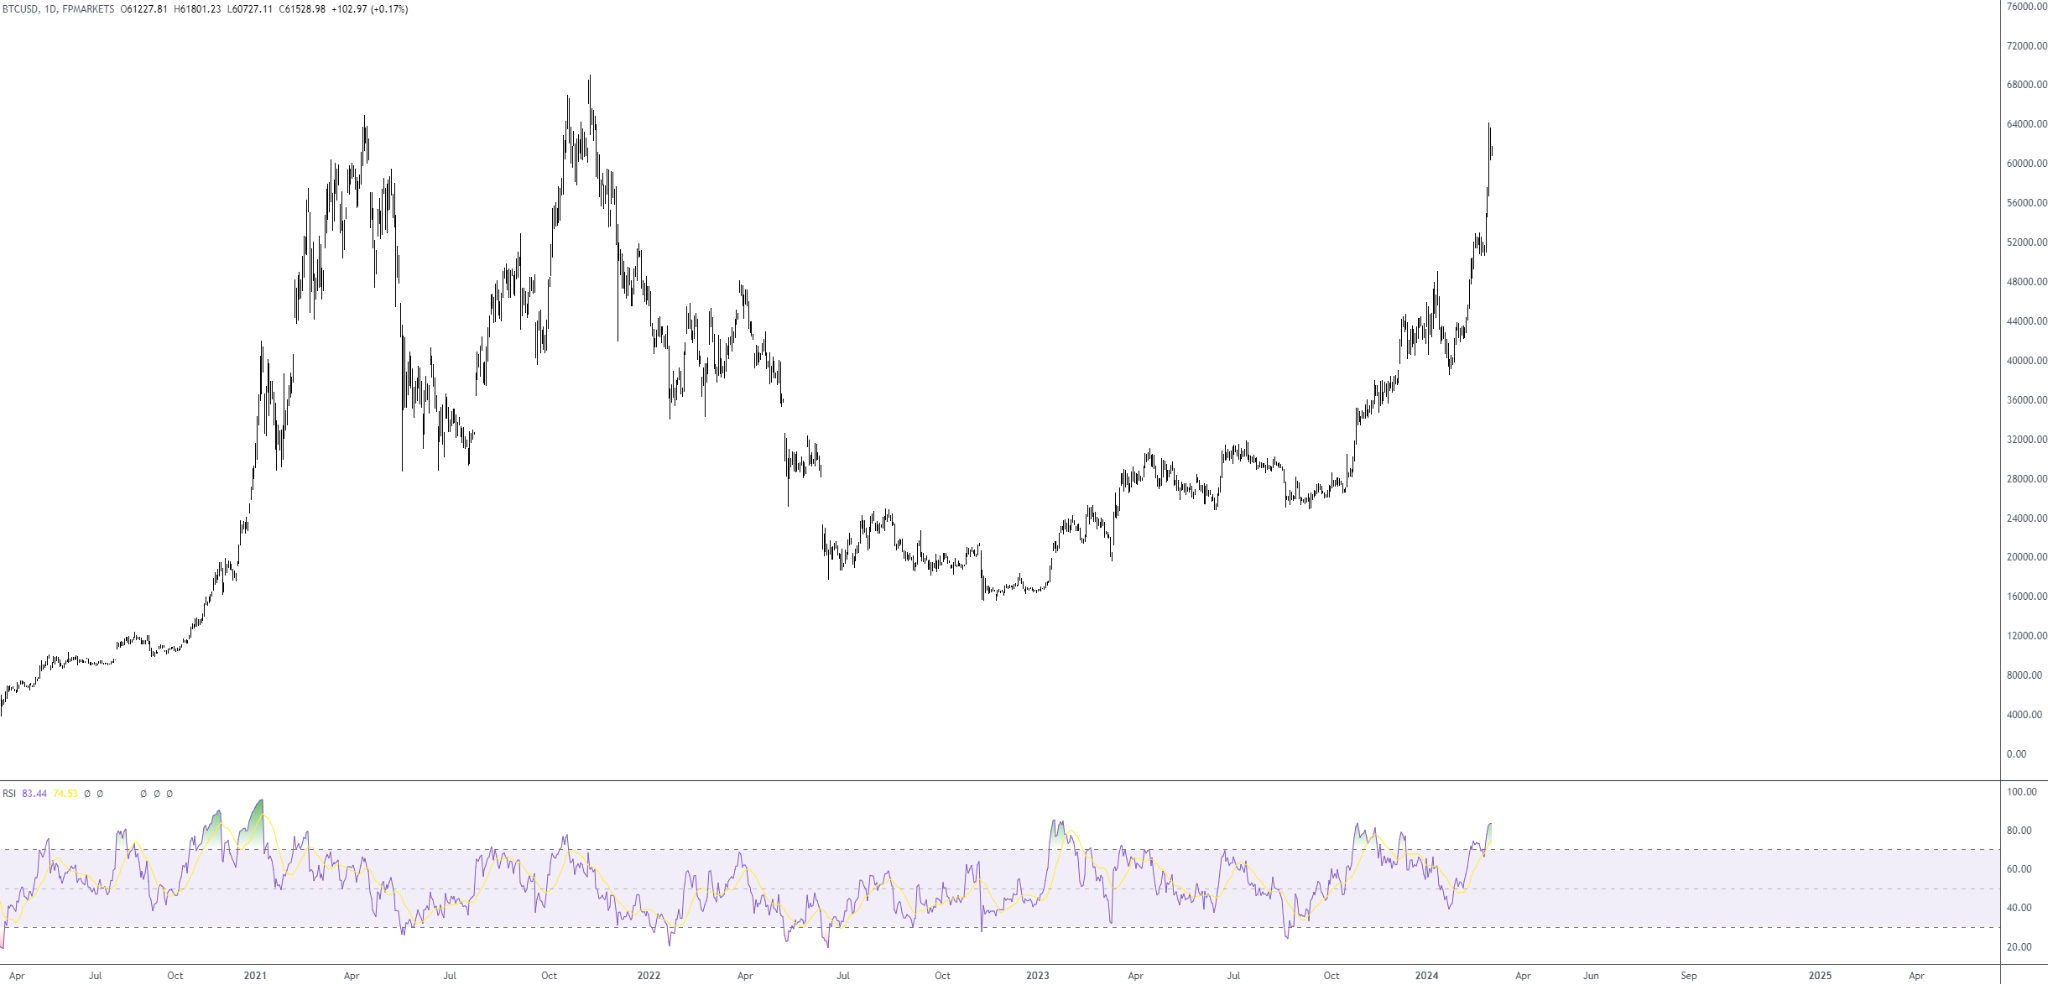
Next up is the Relative Strength Index (RSI), a momentum oscillator that monitors the velocity of price movement: how fast/slow prices change. It is measured based on average gains and losses over a certain amount of time, usually 14 periods.
The technical indicator oscillates between 0 to 100; above 70 translates to an overbought security (suggesting that the market could be primed for a bearish reversal or a breather), while below 30 indicates oversold conditions, implying the security might be undervalued and potentially signalling a bullish reversal.
Why the RSI?
- Overbought and Oversold Conditions: Traders use the RSI to identify extreme conditions where the market is likely to reverse. However, do note that overbought and oversold conditions can remain in play for prolonged periods in uptrends and downtrends.
- Divergence: A divergence occurs when the RSI diverges from price action. For instance, if the price of an asset creates a higher high but the RSI does not, it indicates weakening momentum and a potential reversal. Regular or classic divergence signals are considered higher probability when formed within overbought and oversold areas.
Bollinger Bands
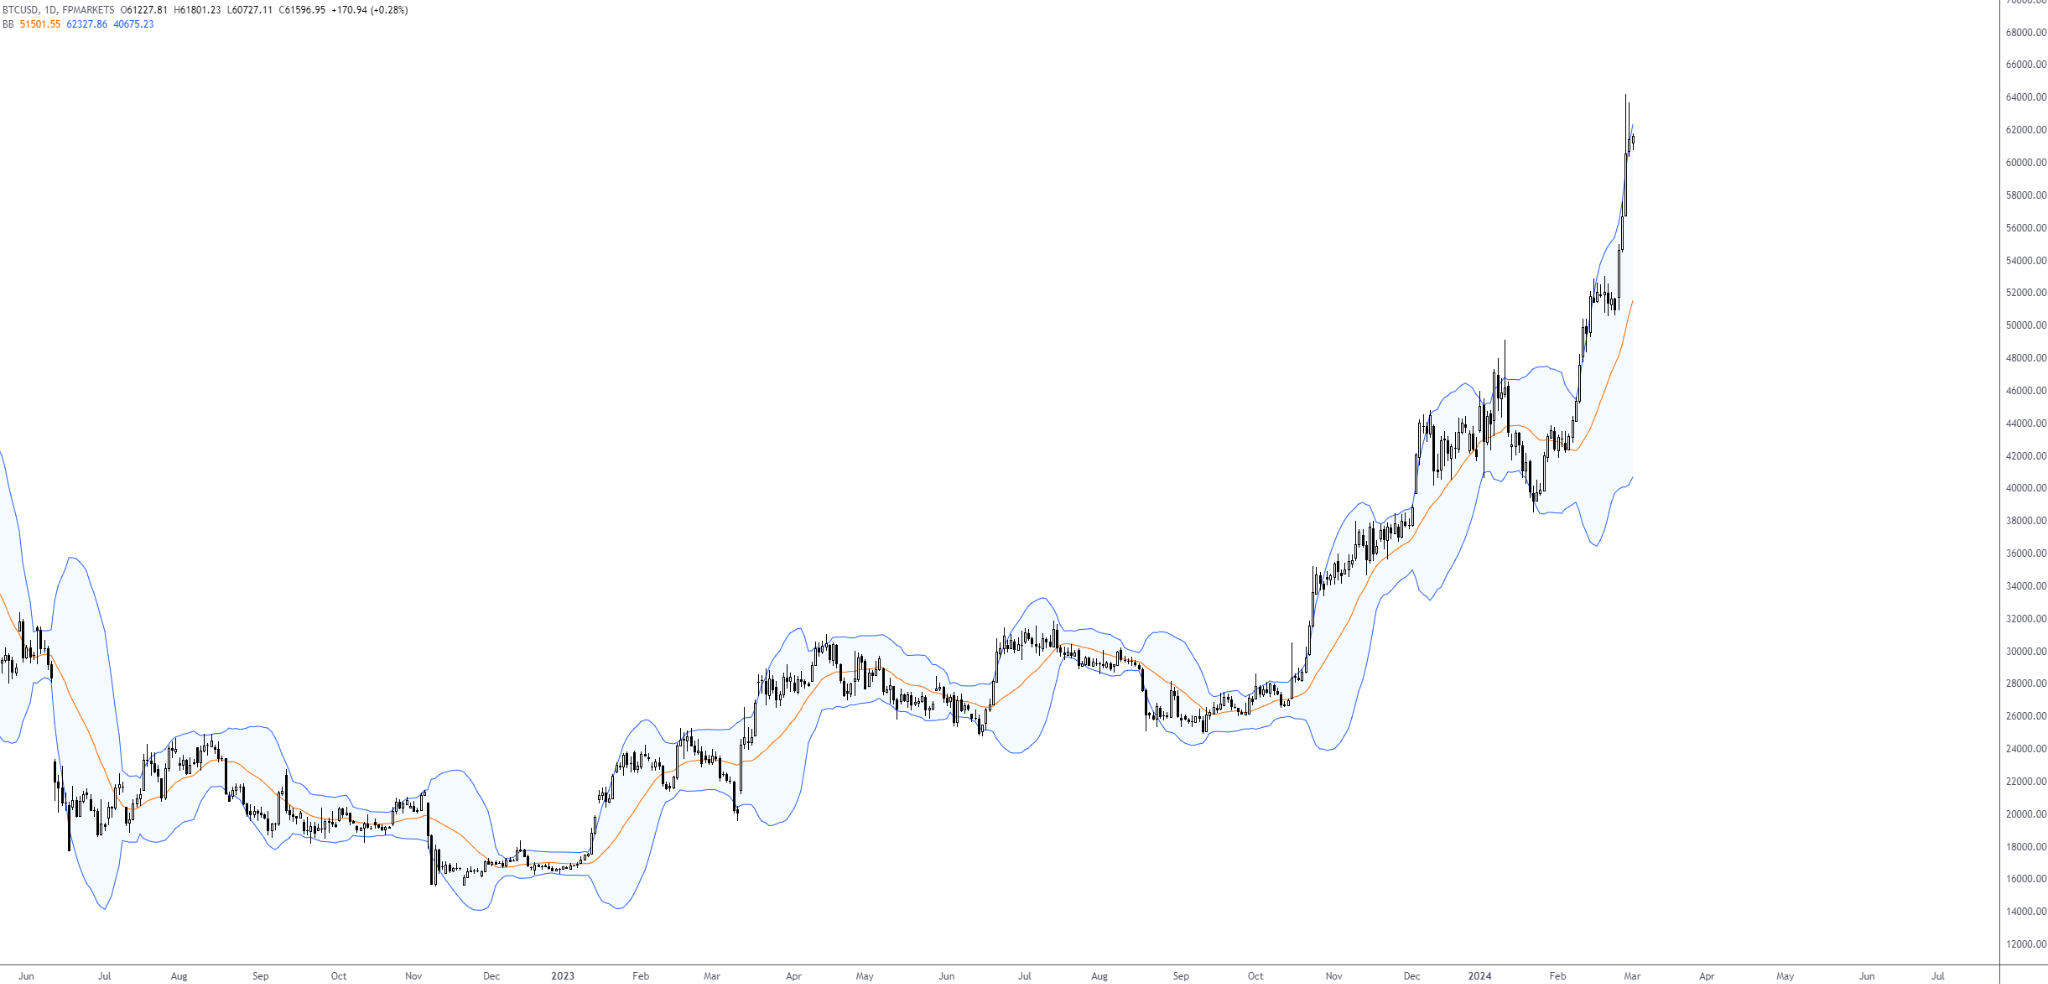
The final indicator is Bollinger Bands, a well-known and widely used volatility indicator. Developed by John Bollinger (not a rockstar, but a financial analyst, which is close enough), these bands adjust themselves based on market volatility. They consist of three lines: the moving average (middle band usually set to 20 periods), an upper band, and a lower band (the outer bands are set to two standard deviations by default but can be changed to suit preferences).
Why Bollinger Bands?
- Volatility Indication: By observing the expansion and contraction of the bands, traders can gauge shifts in market volatility. Periods of contraction are generally followed up with sudden expansions, offering traders a pre-emptive signal of increased market activity.
- Price Targeting: The bands also help in setting price targets. If the price hits the upper band, it might be time to sell, for example. If it hits the lower band, buying could be a good idea.
Incorporating These Indicators Into Your Trading Strategy
Using these indicators together might help improve your trading strategy, but remember, no indicator is a crystal ball.
Here's a simple way to integrate them:
- Start with Moving Averages to identify the overall trend. Is it an uptrend, downtrend, or range-bound market?
- Check the RSI for overbought or oversold conditions. This can give you clues about potential reversals or continuation of the trend.
- Use Bollinger Bands to gauge market volatility and potential price targets.
Final Thoughts
In the end, these indicators are tools, not treasure maps. They won't lead you directly to the gold, but they can help you navigate the sometimes treacherous waters of the market. Like any good sailor, you need to understand your tools, know your ship (or trading platform), and keep an eye on the horizon (market trends).
Remember, the market is as predictable as the sea. Sometimes it's calm, and sometimes it’s volatile. Stick to your plan, be smart with your indicators, and don't put all your eggs in one basket.
