
‘Cagey’ Rebound on BTC/USD?
Since BTC/USD (Bitcoin versus the US dollar) rebounded from the 200-day simple moving average (SMA) earlier this month at US$78,111, speculative bullish interest has been uninspiring.
Further Downside
As far as I can see, the major crypto pairing demonstrates scope to continue exploring south until it reaches support from US$68,926 on the monthly timeframe (I also noted this in previous analysis), which (somewhat) helps explain why technical demand from the 200-day SMA could be lacking.
Another technical observation supporting the lacklustre bullish showing is the Relative Strength Index (RSI), recently exiting overbought territory and fast approaching the neckline of a double-top pattern on the monthly chart, extended from the low of 60.44. A break beyond this line highlights the RSI’s 50.00 centreline threshold as a possible downside target. Adding to this, the RSI on the daily chart may have rebounded from oversold territory (forming a possible double-bottom), but remains south of 50.00 and is shaking hands with resistance around 45.46.
Monthly/Daily Support Area Warrants Attention
While I am not saying that a move to the upside won’t be seen, the path of least resistance appears to be to the downside, at least targeting space below the 200-day SMA at daily support from US$73,575. So, for me, the playbook here will be watching for possible fading opportunities at the underside of the daily range between US$108,396 and US$91,591 (which happens to converge closely with the 50-day SMA at US$93,608 and trendline resistance, extended from the all-time high of US$109.580). Alternatively, we could see price sell-off at current levels and aim for the noted daily support. It is this level, coupled with monthly support mentioned above at US$68,926, that I expect to see bulls attempt to make a show.
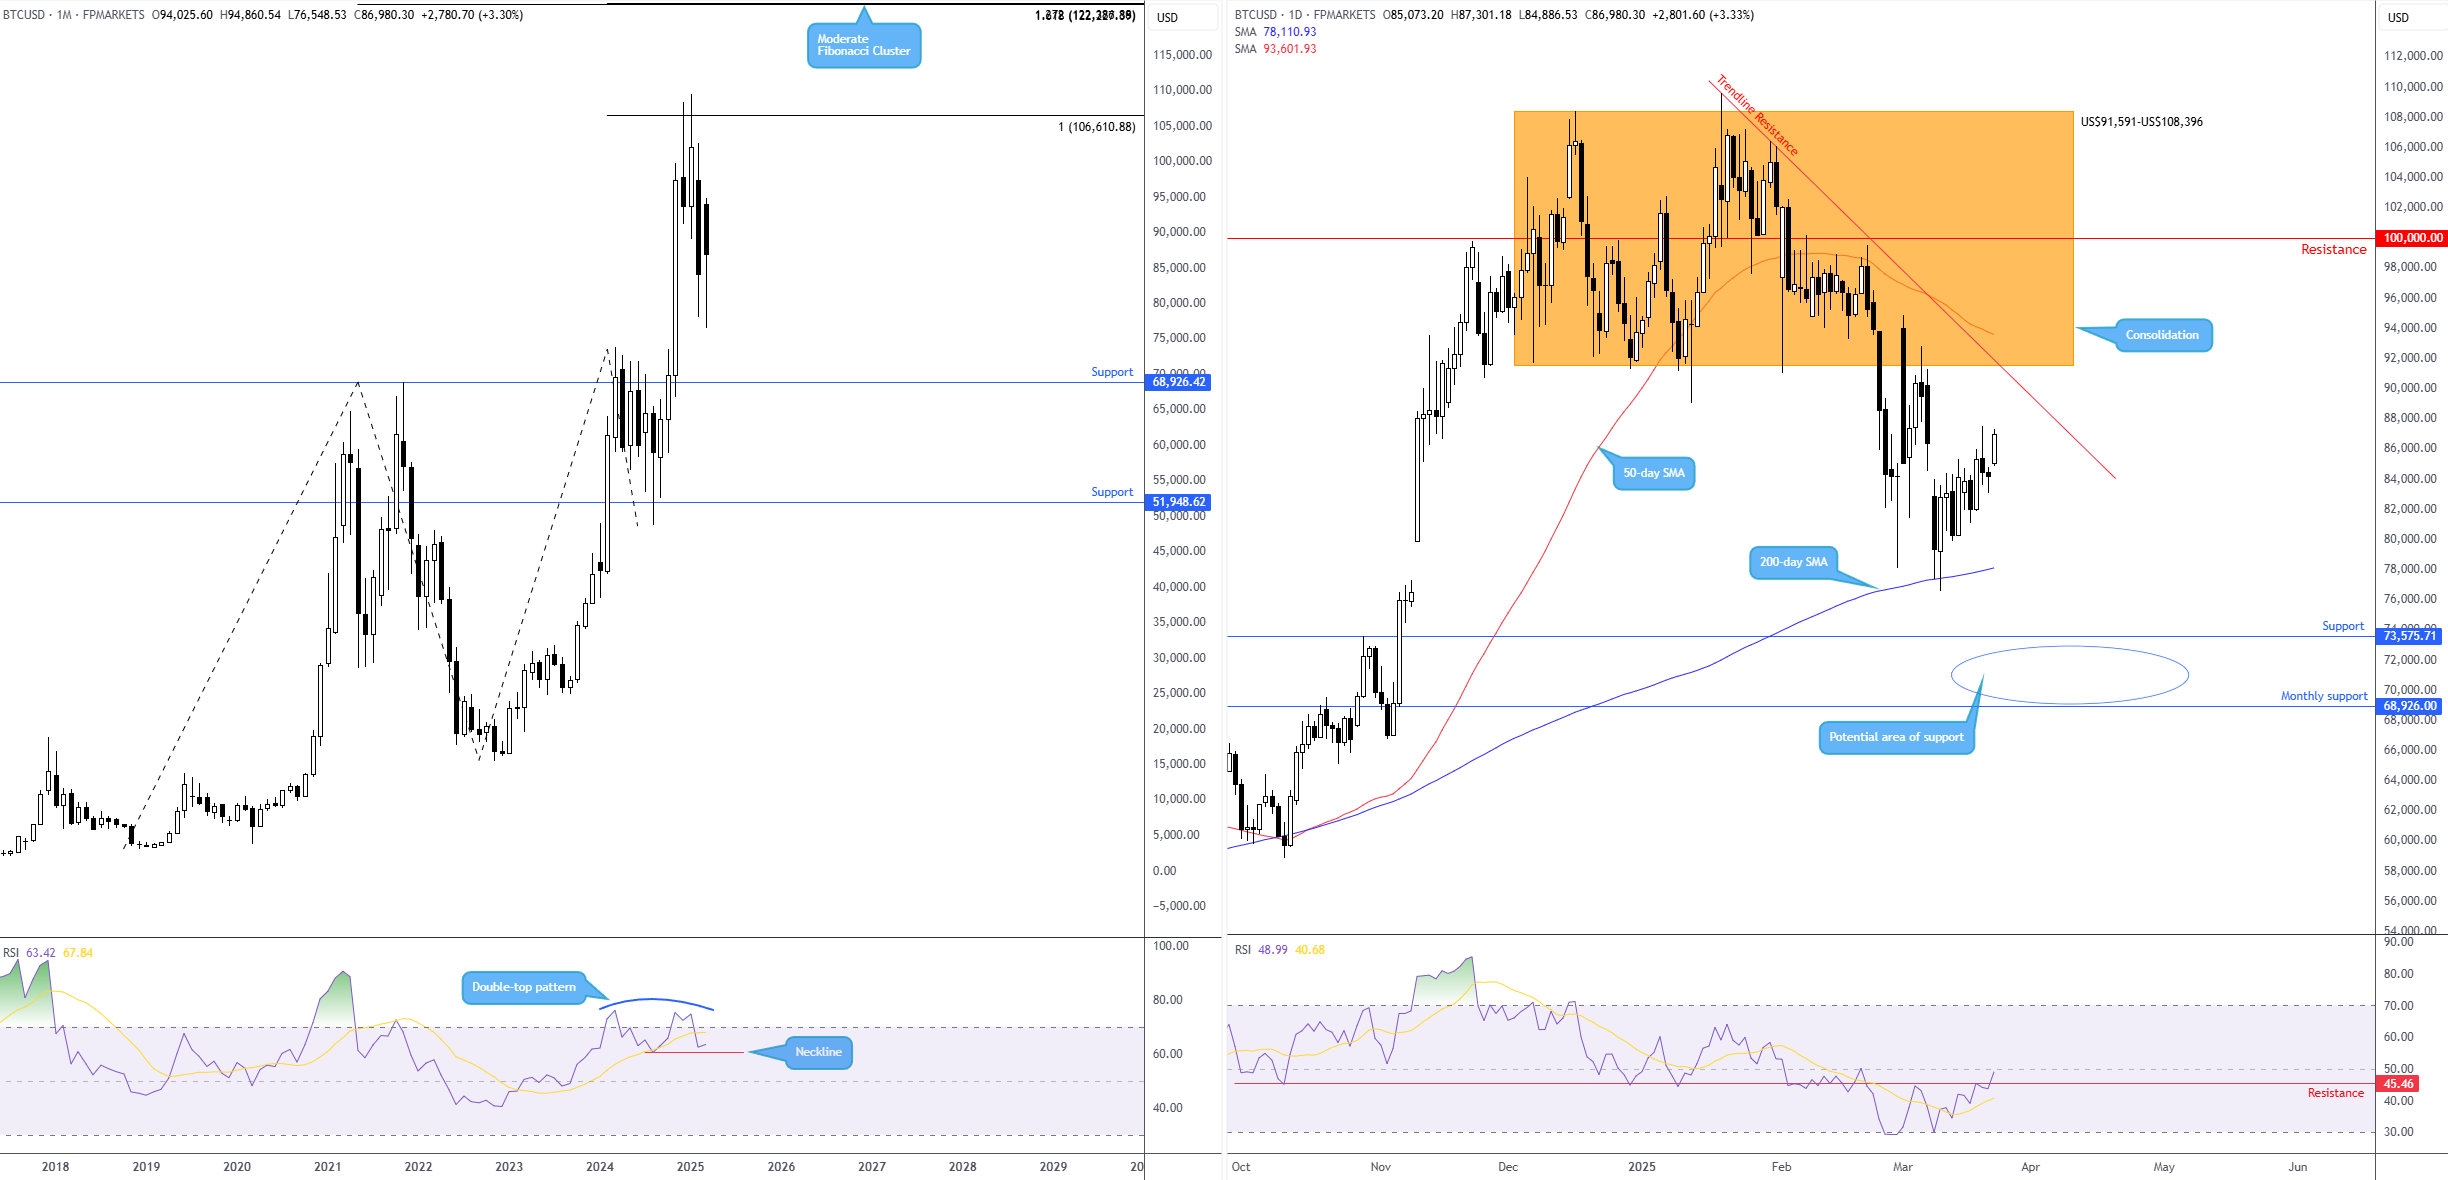
Charts created using TradingView
Written by FP Markets Market Analyst Aaron Hill
DISCLAIMER:
The information contained in this material is intended for general advice only. It does not take into account your investment objectives, financial situation or particular needs. FP Markets has made every effort to ensure the accuracy of the information as at the date of publication. FP Markets does not give any warranty or representation as to the material. Examples included in this material are for illustrative purposes only. To the extent permitted by law, FP Markets and its employees shall not be liable for any loss or damage arising in any way (including by way of negligence) from or in connection with any information provided in or omitted from this material. Features of the FP Markets products including applicable fees and charges are outlined in the Product Disclosure Statements available from FP Markets website, www.fpmarkets.com and should be considered before deciding to deal in those products. Derivatives can be risky; losses can exceed your initial payment. FP Markets recommends that you seek independent advice. First Prudential Markets Pty Ltd trading as FP Markets ABN 16 112 600 281, Australian Financial Services License Number 286354.
