
Beginners Guide to Stochastic Oscillator Trading Strategies
Reading time: 9 minutes
Ask 100 successful traders how they determine trading decisions, and you’ll receive 100 different answers. That’s one of the benefits of trading: its flexibility. However, with countless markets to trade and numerous trading strategies to choose from, it is no wonder that many new traders feel overwhelmed when they begin learning about technical analysis. Still, some technical indicators, including the Stochastic Oscillator, have stood the test of time and are widely used by professional traders. With that being said, this indicator represents a good starting point for many newer traders.
What is the Stochastic Oscillator?
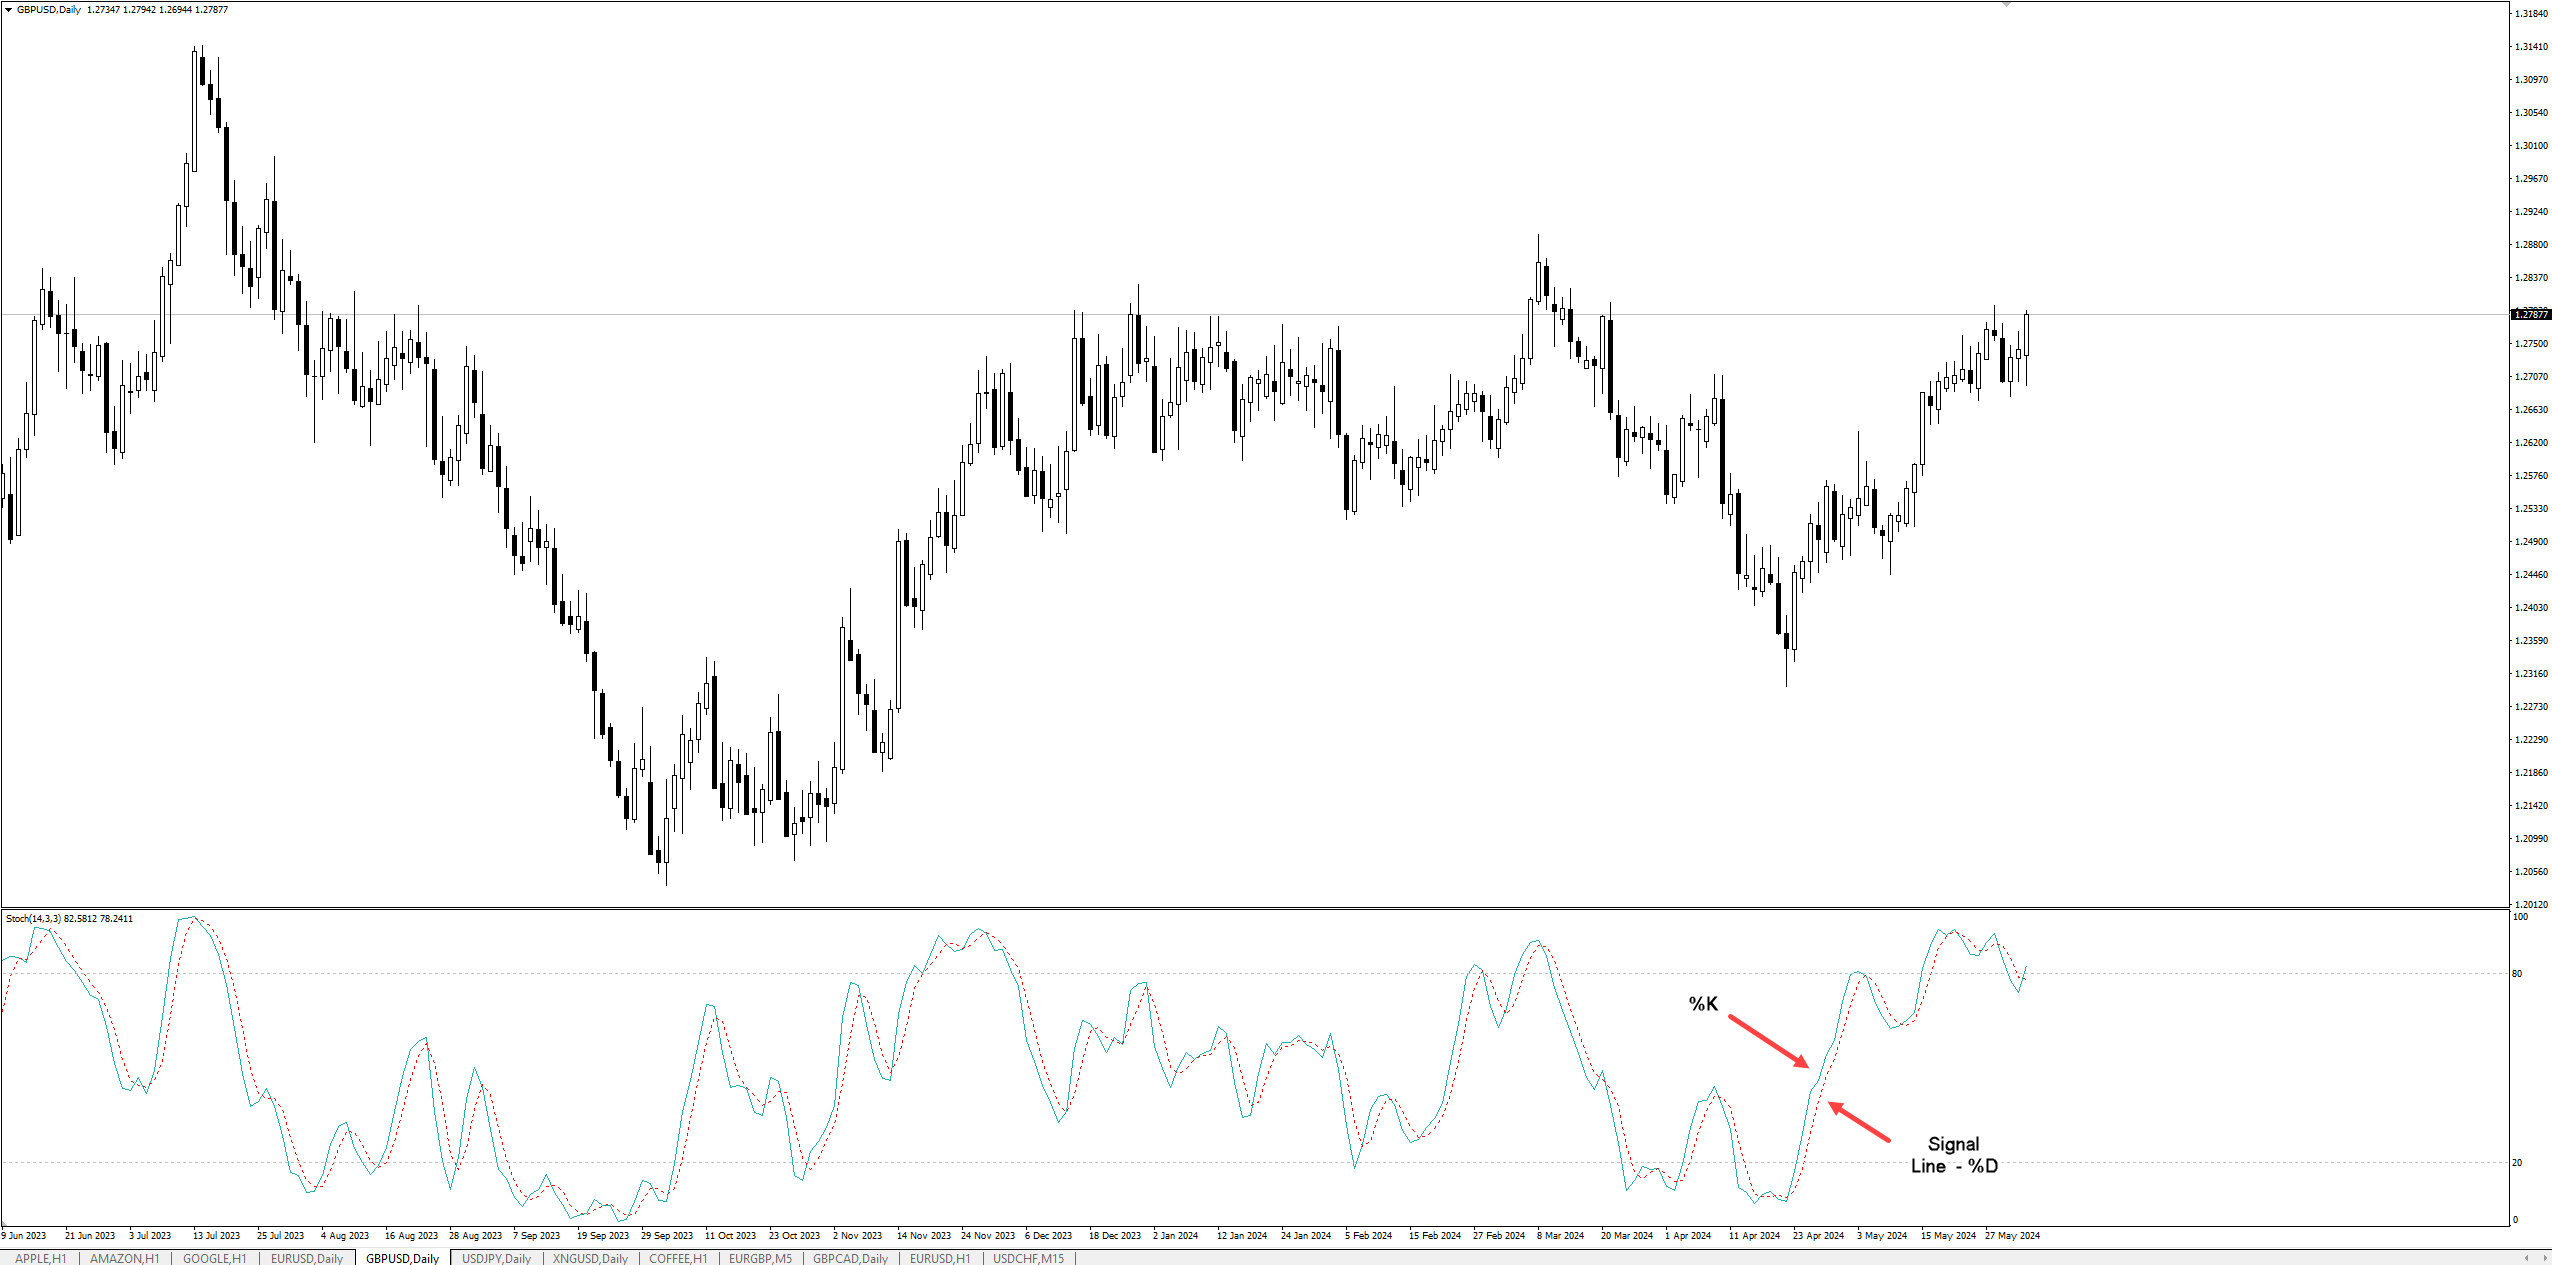
Figure 1: MetaTrader 4 GBP/USD Daily Chart
Developed in the 1950s by George C. Lane, the Stochastic Oscillator, or ‘Lane’s Stochastics’, serves as a bounded momentum indicator that reflects the relationship (the location) between a security’s closing price and the range, the high and low, over a predetermined period. Figure 1 shows the Stochastic Oscillator applied to the daily chart of GBP/USD.
The idea behind the indicator is that as price action moves, either to the upside or downside, the closing prices for the timeframes traded will edge closer to the upper and lower extremes of the range, respectively. This, through the Stochastic Oscillator’s easy-to-read display, offers information that can be used to formulate high-probability trading strategies.
Stochastic Oscillator Calculation
Although many do not possess the desire to understand the calculation behind the Stochastic Oscillator (all trading platforms perform the calculation for you), absorbing the formula can help foster a clearer perception of the trading signals and how these are applied.
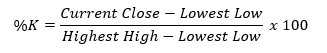
The indicator consists of %K and %D, two constant, continuous-flowing lines that traders must become accustomed to (see Figure 1). The %K is calculated by subtracting the current close and the lowest low over the period chosen and dividing this by the difference between the highest high and the lowest low over the same period, and finally multiplying this by 100. The %D is simply the 3-day simple moving average of %K, thus smoothing out its fluctuations. Therefore, %K is the faster of the two lines and serves as a signal line, while %D is the slower line.
Importantly, the default timeframe commonly used is 14 periods. This could be 14 minutes for the 1-minute chart, for example, 14 hours for the hourly chart or even 14 days for the daily chart. As you can see, traders can apply this indicator across all timeframes (suiting all trading styles) and across all markets , as well as having the option of altering the default period. Additionally, the lowest low in the formula represents the lowest low seen over the period used (so, for 14 periods, this would be the lowest low over the last 14 days for the daily chart), while the highest high is the highest value traded over the period used.
Stochastic Trading Strategies for Beginners
Like all trading ideas and methods, it is recommended to back-test and forward-test these concepts to demonstrate their validity. Performing a back-test allows you to tweak the system's parameters to ensure that it contains an edge that you can exploit in the live markets. However, it is imperative that you also forward-test your ideas using out-of-sample data (price action not yet seen by the system in the back-test) to confirm you have not succumbed to curve fitting.
Three common trading strategies are frequently employed among newer traders, including overbought/oversold trading, crossovers and divergences.
Overbought and Oversold Zones:
As shown on the GBP/USD daily chart below (Figure 2), the indicator appears as two continuous lines oscillating between 0 and 100. Readings above 80 suggest overbought market conditions, indicating a potentially overheated market and may be due a downward reversal. Conversely, readings beneath 20 signify oversold conditions, where the price has potentially overextended to the downside and may be poised to print a reversal to the upside.
However, while these thresholds can be adjusted to suit your trading style and preferences, the Stochastics Oscillator can remain overbought or oversold for prolonged periods, particularly in trending markets (this is why many traders and investors recommend using this indicator in ranging markets).
Importantly, overbought and oversold signals are usually taken alongside other technical tools, such as support and resistance and the trend. In fact, a common trading strategy involves identifying trend direction and seeking to buy corrections (sell pullbacks) in an uptrend (downtrend), aided by oversold and overbought signals. An example of a buy position in a medium-term uptrend can be seen in Figure 2: the GBP/USD daily chart reaches a high of $1.2680 and forms a correction back to support at $1.2312, which is accompanied by the Stochastic Oscillator offering up an oversold signal. Regarding entry and stop-loss orders, traders tend to enter around the support or resistance area and base stop-loss orders beyond the next logical support or resistance area. Traders may even take things a step further and wait for additional confirmation in the form of a candlestick pattern, which can help with entry and setting a location for stop-loss orders.
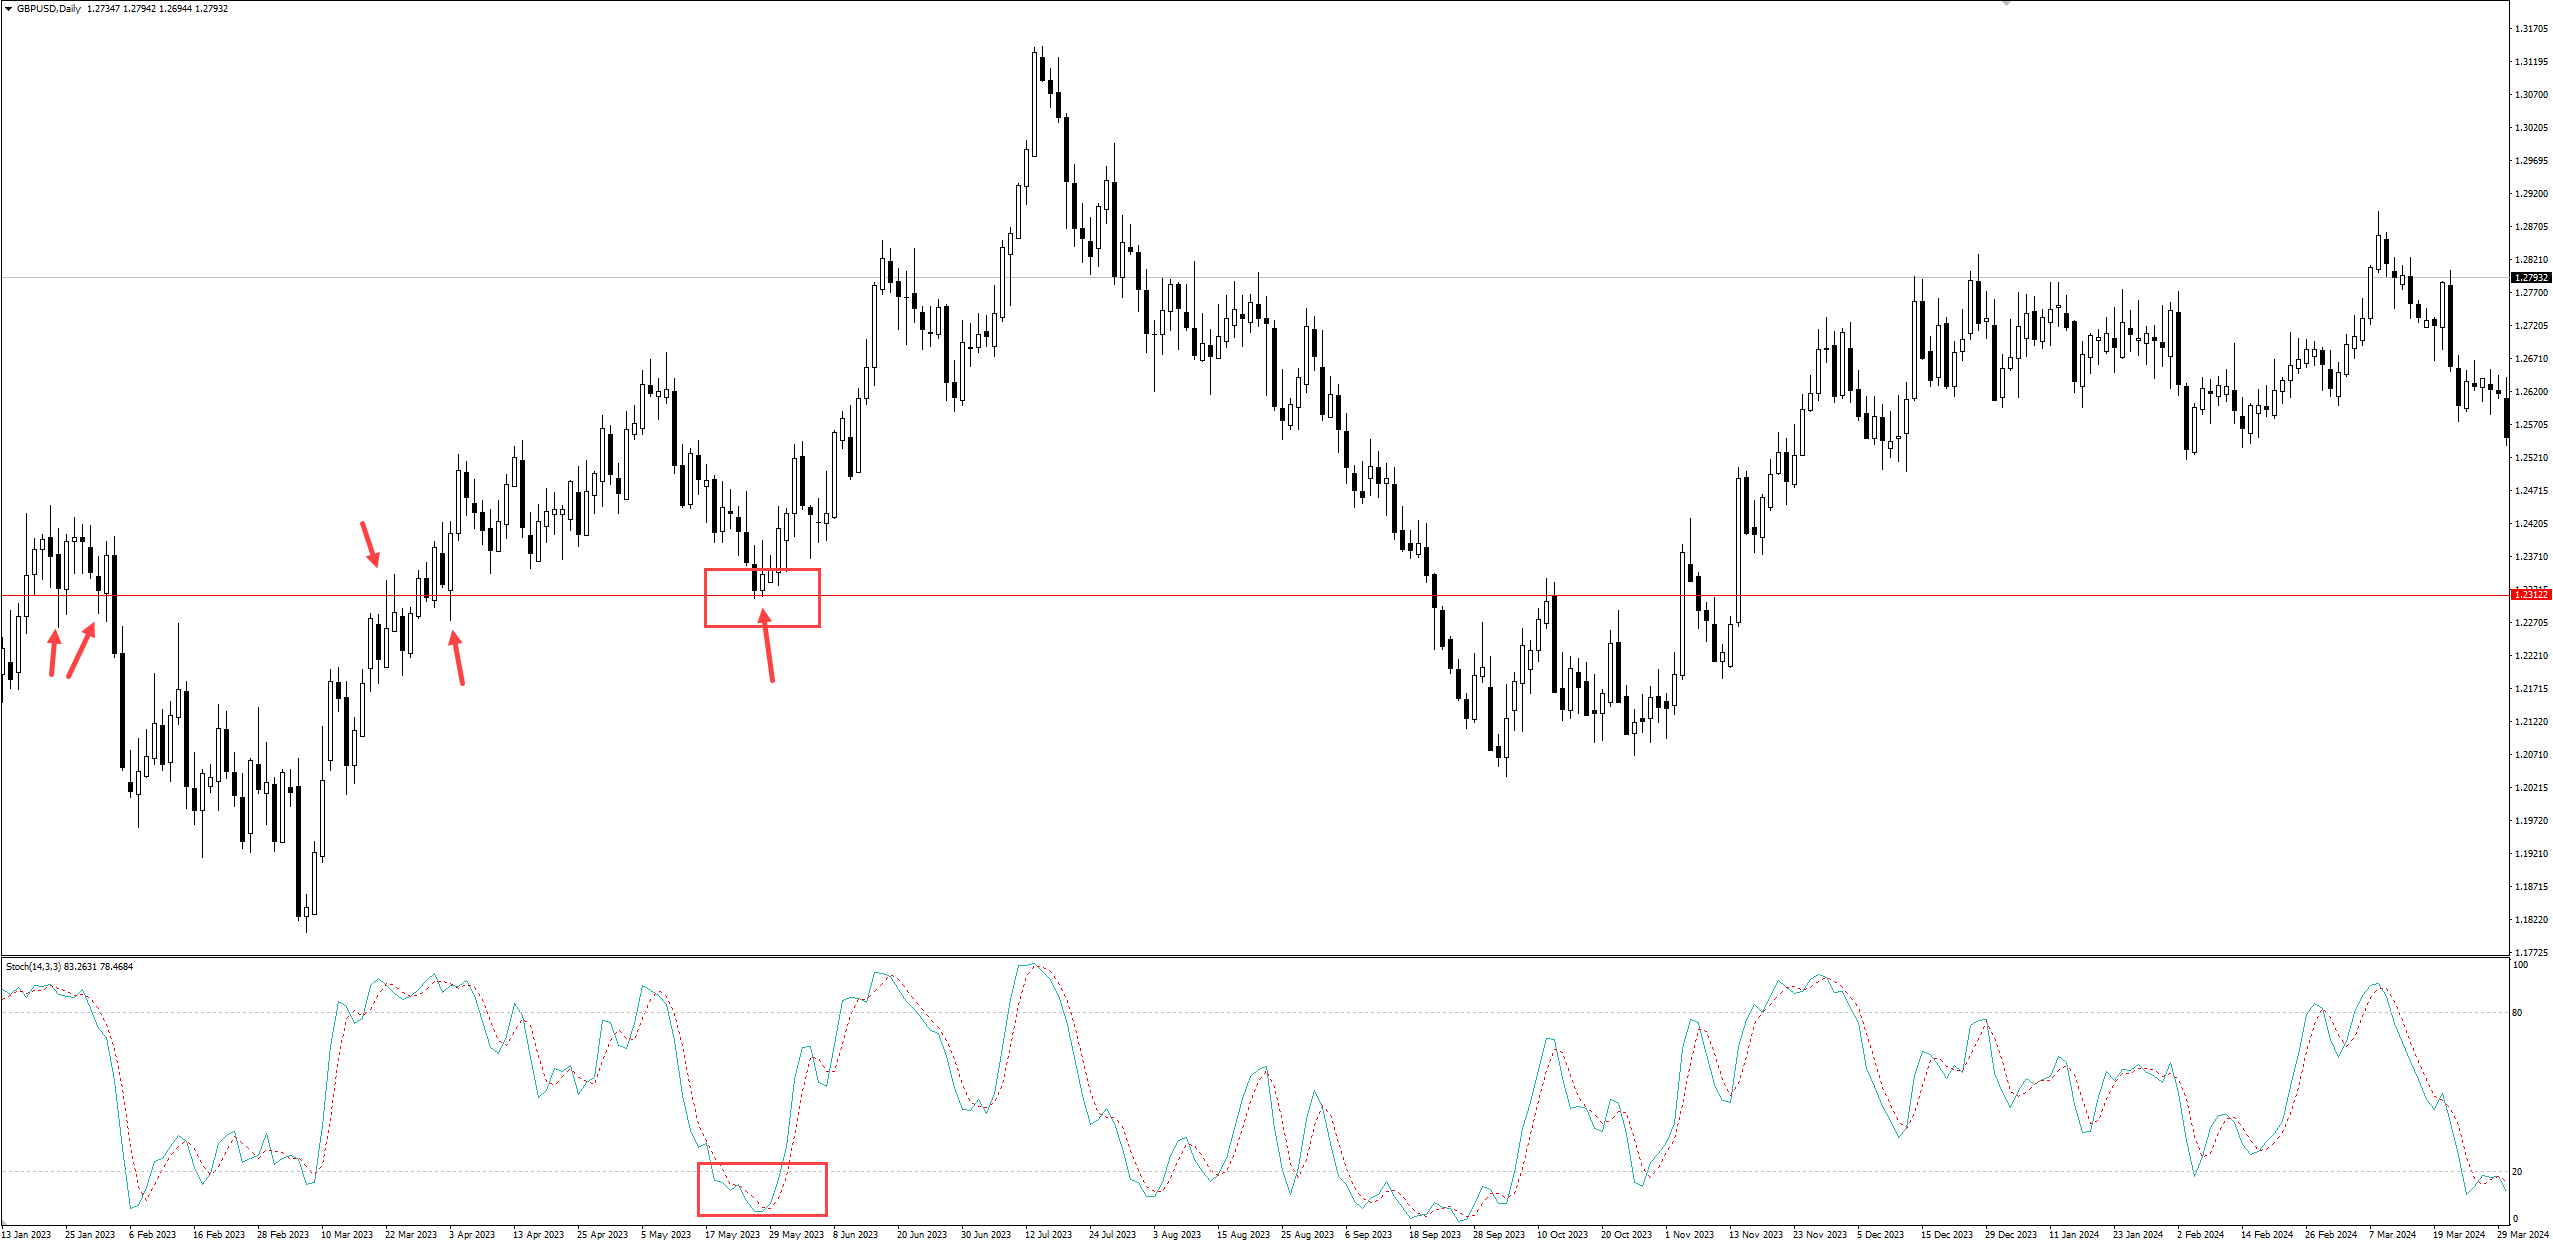
Figure 2: MetaTrader 4 GBP/USD Daily Chart
Crossover Strategy:
The Crossover Strategy concentrates on the crossing points of the %K and %D lines and is essentially the same as a typical moving average Crossover System.
Traders look for buy signals when the %K line makes its way north of %D from below (this can be particularly effective when combined with an oversold signal [below 20]). At the same time, when the %K line crosses below the %D line from above, especially near overbought territory (above 80), it might indicate a possible price decline.
Using the same chart in Figure 2, Figure 3 below shows that the test of support, alongside the uptrend and the oversold conditions, was accompanied by a bullish crossover: the %K line crossed above %D, further confirming a bullish scenario.
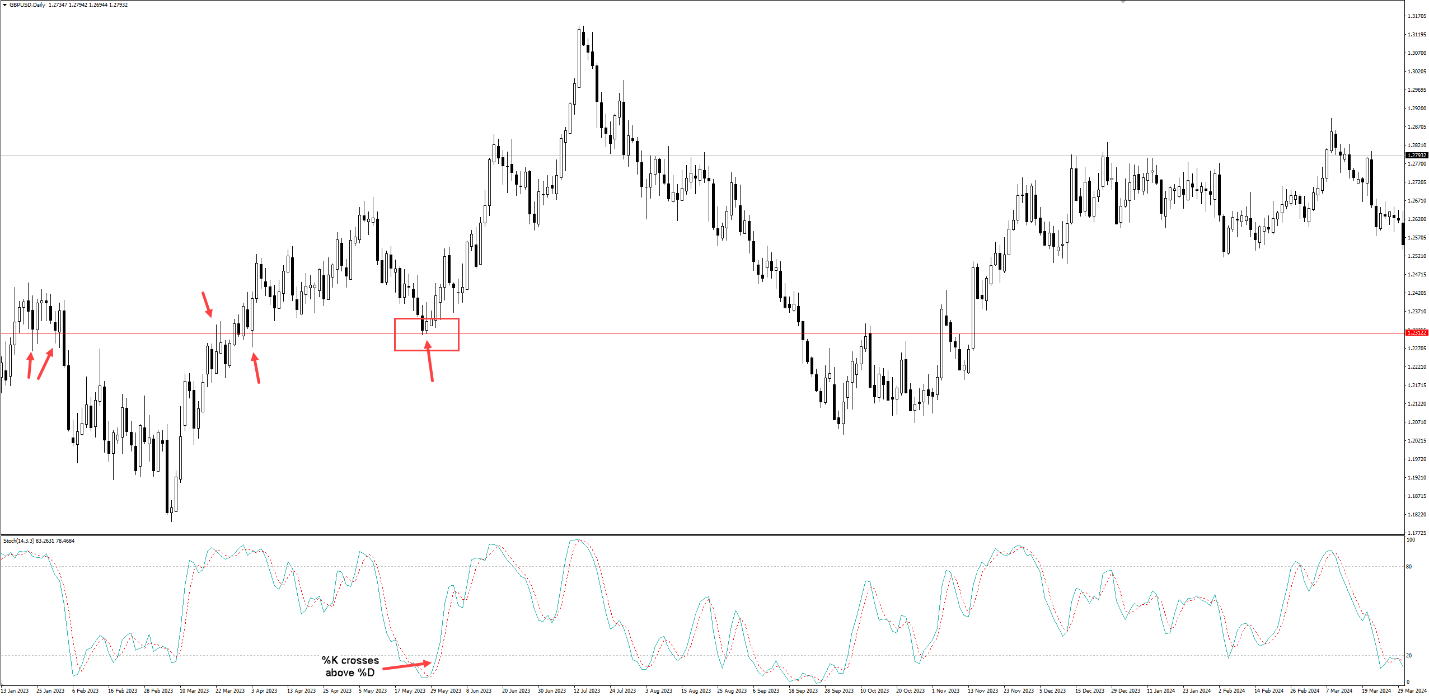
Figure 3: MetaTrader 4 GBP/USD Daily Chart
Divergences:
A bullish or bearish Divergence occurs when price movement contradicts the Stochastic Oscillator.
When price forms a higher high, for example, traders, particularly trend traders, look for signs of further strength. However, if the Stochastic Oscillator fails to mirror price movement and pencils in a lower low, this can suggest weakening buying pressure and a possible change in momentum. This is referred to as a bearish divergence, as shown in Figure 4 using the H1 chart of GBP/USD. Price formed a higher high, but the Stochastics Oscillator established a lower high, indicating weakening upside pressure and this can be used to formulate a bearish strategy. The same can be said for bullish divergences; only price movement forms a lower low, and the Stochastic Oscillator prints a higher high.
Again, it is crucial to understand that the Stochastic Oscillator’s signals are not designed to be traded in isolation. The signals should be combined with other technical tools to determine an area of confluence: the more evidence there is to trade, the higher the probability of a reaction materialising.
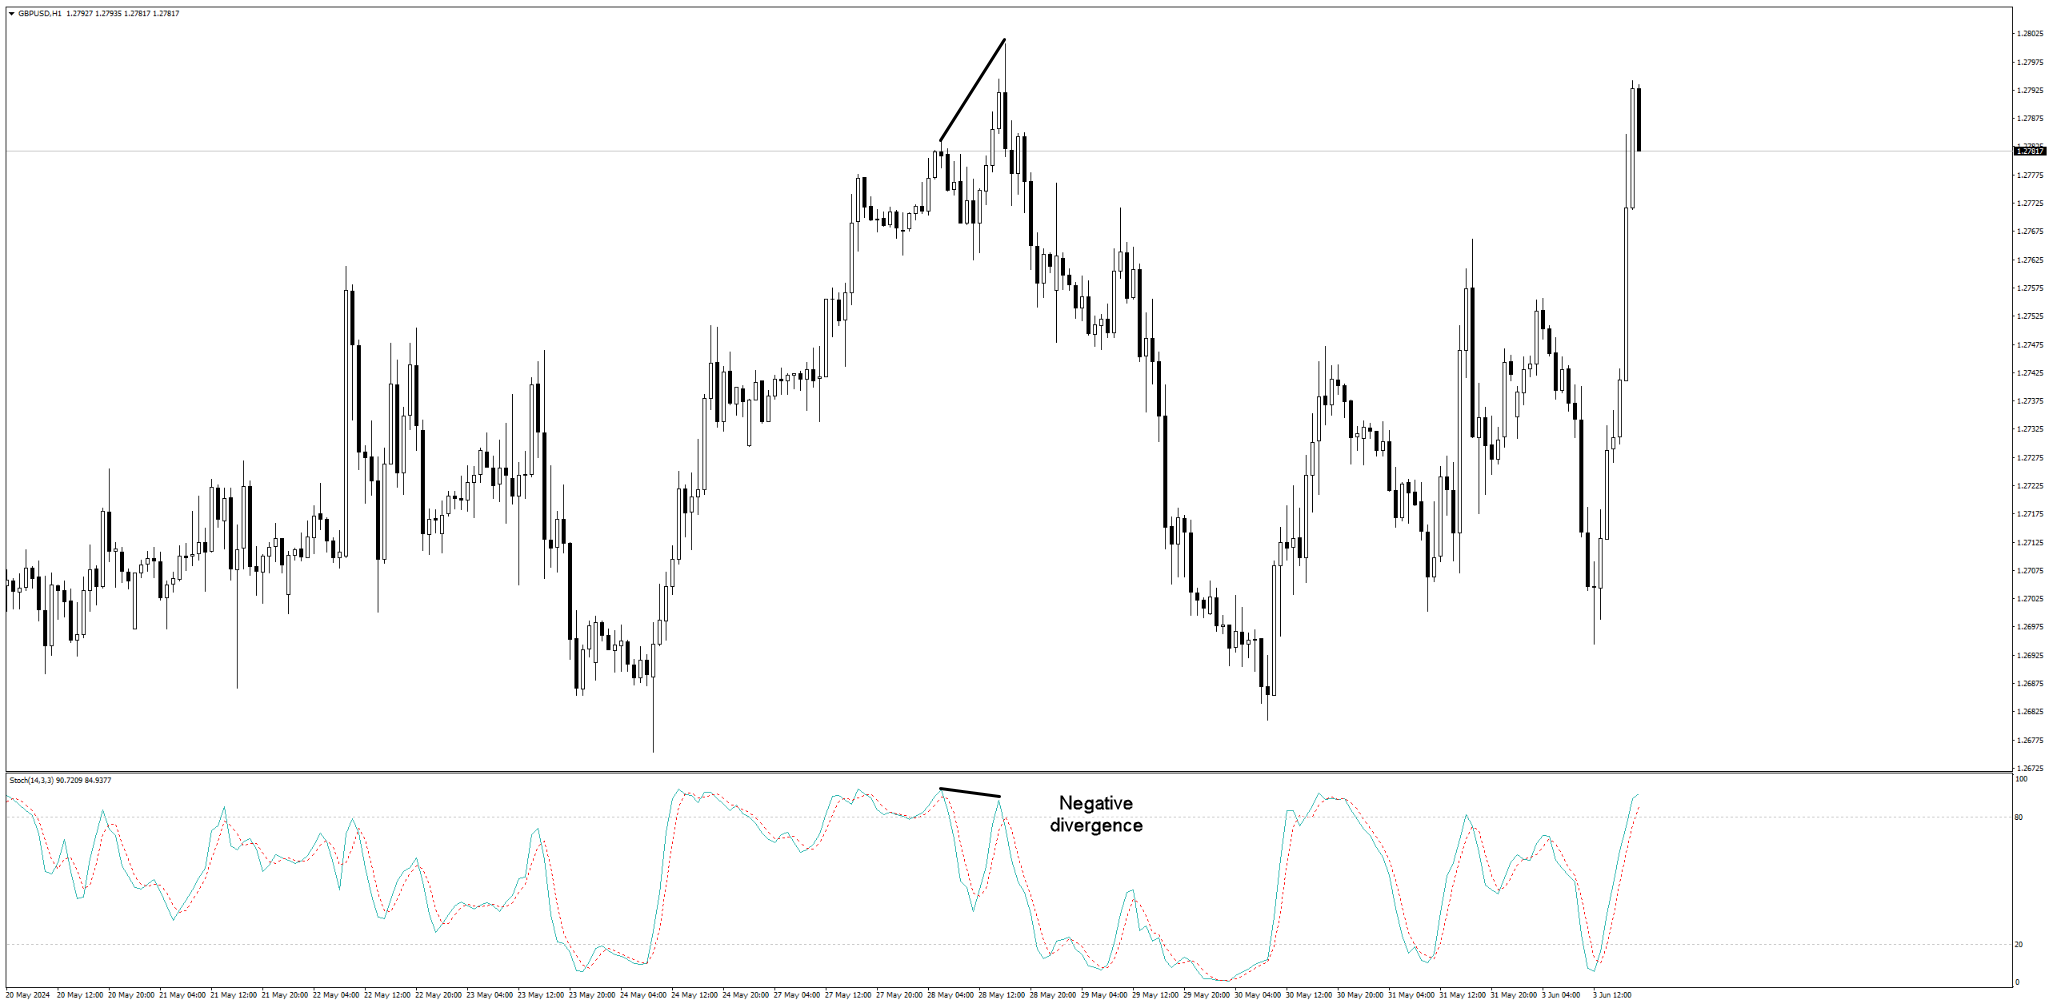
Figure 4: MetaTrader 4 GBP/USD H1 Chart
Stochastics FAQs:
1. What is the Stochastics Oscillator?
The Stochastic Oscillator is a unique technical indicator that measures the location of a market’s closing price based on the high and low range over a set period. The closer the closing prices are to the extremes of the range helps highlight overbought and oversold conditions.
2. How can I trade using the Stochastic Oscillator?
Like all technical indicators, the Stochastic Oscillator offers many techniques, including identifying overbought and oversold conditions at support and resistance and employing crossovers and divergences. To validate a trading strategy’s effectiveness, back-testing and forward testing are recommended.
3. What trading platforms can the Stochastics Oscillator be used on?
Most reputable trading platforms offer the Stochastic Oscillator, including MetaTrader 4 (MT4) and MetaTrader 5 (MT5), cTrader and TradingView. Why not consider opening a demo trading account with FP Markets and begin applying the Stochastic Oscillator to real-time global markets?
