
Trump’s Reciprocal Tariffs Take Effect; Bonds and Stocks Hit
Following US President Donald Trump’s ‘Liberation Day’ last week, a 10% baseline tariff on all nations took effect on 5 April, followed by higher levies on approximately 60 countries that kicked in today. This includes a 20% tariff on all goods imported from the European Union and hefty tariffs on several imports from Asia Pacific countries, such as Cambodia and Vietnam, representing a substantial blow to these export-oriented nations.
104% Tariff Imposed on China
Trump followed through on his threats to impose an eye-watering 104% tariff on Chinese goods as the two largest economies of the world edge closer to an all-out trade war. This back-and-forth exchange started in February after Trump enacted a 10% tariff on Chinese goods due to concerns regarding fentanyl-related trade. Another 10% levy was imposed in March, followed by last week’s 34% reciprocal tariff, and another 50% today after China declared it would ‘fight to the end’ and refused to remove its 34% countermeasures which were enforced recently.
Tariffs Shake Equities and Bonds
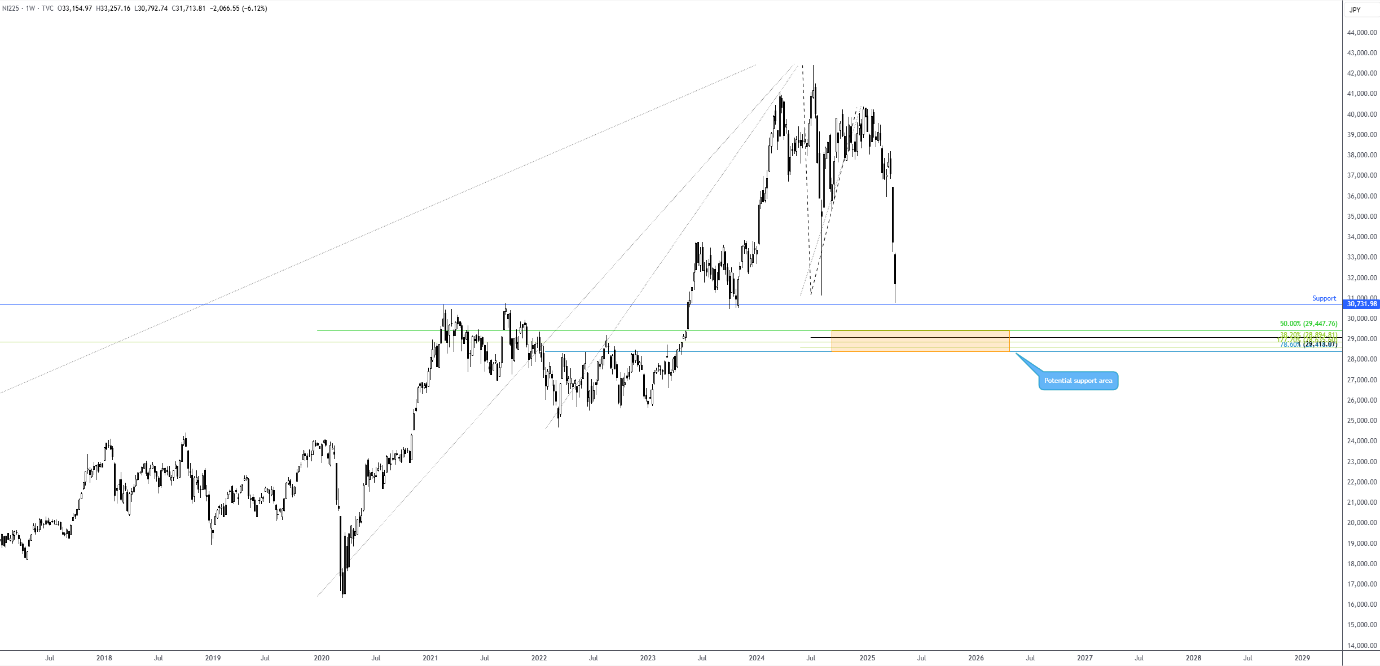
Risk assets have plunged today. Equity markets in Asia finished the session down across the board. Japan’s benchmark index – the Nikkei 225 – recorded losses of nearly 4.0%, which wiped out most of the previous day’s recovery gains.
As the saying goes, a picture is worth a thousand words. The weekly chart of the Nikkei 225, shown below, illustrates the precipitous decline observed in Asia, which has recently reached bear market territory and refreshed lows not seen since late 2023. Although price action is technically within striking distance of well-defined support at 30,731, another support zone worth watching is between 28,413 and 29,447, a base predominantly composed of Fibonacci ratios and a potential AB=CD support (100% projection ratio).
European equity markets also opened underwater today, and global bonds have fallen sharply. Longer-dated US Treasury yields surged across the curve; the benchmark 10-year yield climbed as high as 4.51%, with the 30-year yield breaching 5.00%. While Treasury bonds are often regarded as a safe-haven asset during market turmoil, the recent sell-off could indicate a potential shift in the ‘safe-haven regime’ amid current heightened uncertainty.
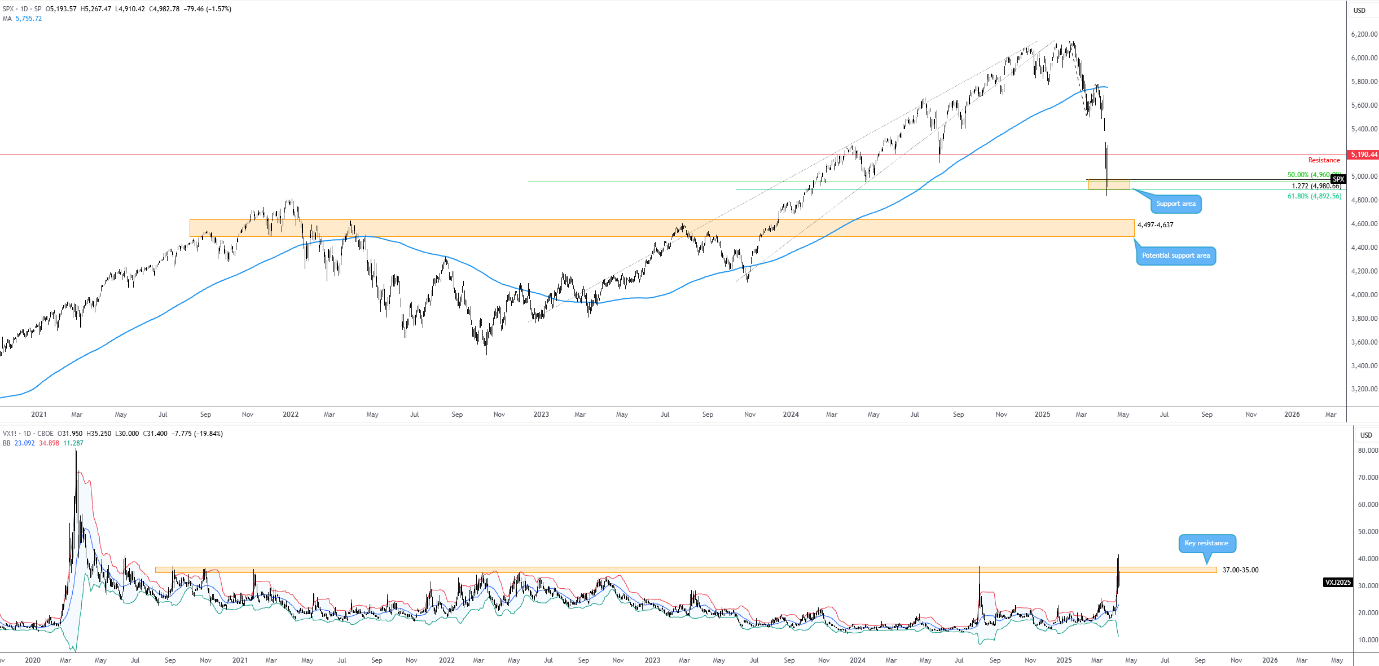
Since Trump announced tariffs earlier this month, the S&P 500 has lost more than 12% and is on the doorstep of bear market territory from the all-time high of 6,147. The Cboe Volatility Index (VIX) also remains at elevated levels around the 30.00 region. The daily charts below show that the S&P 500 continues to shake hands with technical support between 4,892 and 4,960. While equity bulls have attempted to make a show from this region – when the VIX reached familiar resistance between 37.00 and 35.00 – technical resistance overhead at 5,190 proved too much to overcome as sellers faded the zone amid tariff escalation. The next layer of support I am watching is between 4,497 and 4,637.
What Next?
The issue with the tariffs is that it only takes one announcement from Trump or a major trading partner to send markets in either direction, making trading challenging. For instance, a rumour surfaced on Monday that Trump was considering a potential 90-day reprieve, underpinning a bid in stocks. However, this rally was short-lived after the White House debunked the story.
As of now, China is the only country that has retaliated and could implement additional countermeasures following the 104% levy currently in effect. The real question is how long this will continue and whether deals will be reached. Trump has recently stated that his team is currently ‘dealing with many countries’.
In my opinion, it makes little sense to try to pick tops and bottoms at this point; the uncertainty level is just too high. With so many wheels turning at once, time will tell how this all plays out.
Written by FP Markets Chief Market Analyst Aaron Hill
DISCLAIMER:
The information contained in this material is intended for general advice only. It does not take into account your investment objectives, financial situation or particular needs. FP Markets has made every effort to ensure the accuracy of the information as at the date of publication. FP Markets does not give any warranty or representation as to the material. Examples included in this material are for illustrative purposes only. To the extent permitted by law, FP Markets and its employees shall not be liable for any loss or damage arising in any way (including by way of negligence) from or in connection with any information provided in or omitted from this material. Features of the FP Markets products including applicable fees and charges are outlined in the Product Disclosure Statements available from FP Markets website, www.fpmarkets.com and should be considered before deciding to deal in those products. Derivatives can be risky; losses can exceed your initial payment. FP Markets recommends that you seek independent advice. First Prudential Markets Pty Ltd trading as FP Markets ABN 16 112 600 281, Australian Financial Services License Number 286354.
