
How Do Global PMIs Affect the Financial Markets?
Reading time: 7 minutes
Released in more than 40 countries, the PMI, or ‘Purchasing Managers’ Index’, is one of the first economic indicators to be released each month and delivers timely signals regarding the private sector economy. Although available across an extensive selection of countries, market-moving reports are generally those produced for the UK, the US, the eurozone, France and Germany.
The timeliness of PMIs is a significant advantage. Unlike official economic data, which can have reporting lags, PMIs offer a near-real-time snapshot of business sentiment. This allows investors to stay ahead of the curve and anticipate future economic trends.
Prepared and released by S&P Global every month, the PMIs survey purchasing managers to rate business conditions. They are considered leading indicators: forward-looking measures that economists use to identify early signals in economic trends, particularly across key macroeconomic statistics, like Gross Domestic Product (GDP), inflation and employment.
How are the PMIs Calculated?
Data are collected using the same methods for each country the report is produced for, allowing for straightforward international comparisons. PMIs can vary significantly across countries due to diverse economic structures and growth stages. Each PMI is established based on a questionnaire survey distributed to approximately 400 companies during the second half of each month, which is subsequently processed by economists at S&P Global.
The main report releases three headline indexes: the Composite Output PMI, the Manufacturing PMI and the Services Business Activity Index. Notably, within each of the three reports, access to sub-indexes is available, which focus on core aspects such as prices and employment.
Below are the index methodologies, calculated as diffusion indexes for each of the Composite, Manufacturing and Services PMIs, according to S&P Global:
- The Composite Output PMI is formed by taking the weighted average of the Manufacturing and Services PMIs.
- The Manufacturing PMI is derived from the weighted average of five indexes: New Orders (30%), Output (25%), Employment (20%), Suppliers’ Delivery Times (15%) and Stocks of Purchases (10%). For the PMI calculation, the Suppliers’ Delivery Times Index is inverted so that it moves in a direction comparable to that of the other indices.
- The Services PMI is equivalent to the Manufacturing PMI, but it only focuses on changes in services business activity.
Do Global PMIs Influence the Financial Markets?
PMIs are not just used by businesses, analysts, and governments to help keep track of economic variables; traders and investors use the reports to seek cues for economic trends . Traders understand that a reading north of 50.00 indicates industry expansion while south of 50.00 represents contraction.
Of relevance, there are also two reports released: the Flash and Final PMIs for each country.
The Flash report for manufacturing and services garners the majority of the market’s attention, which is generally released in the last full week of the month on the same day. For example, a positive reading, specifically in the manufacturing area, can lift equity markets higher on the basis of increased production and demand, while a weaker reading indicates slowing economic activity and raises concerns about corporate earnings, which can lead to a lower equity market. For currencies, a strong PMI reading may boost a country’s currency as it suggests improving business conditions, potentially attracting foreign investment and strengthening the currency, and vice versa for a weaker PMI release. A strong manufacturing PMI can also indicate rising demand for raw materials, potentially leading to higher commodity prices. Conversely, a weak PMI suggests lower demand and potentially declining commodity prices.
The Final print is available a week or so later, and many countries release the manufacturing and services reports on different days. By and large, most market participants overlook the final release.
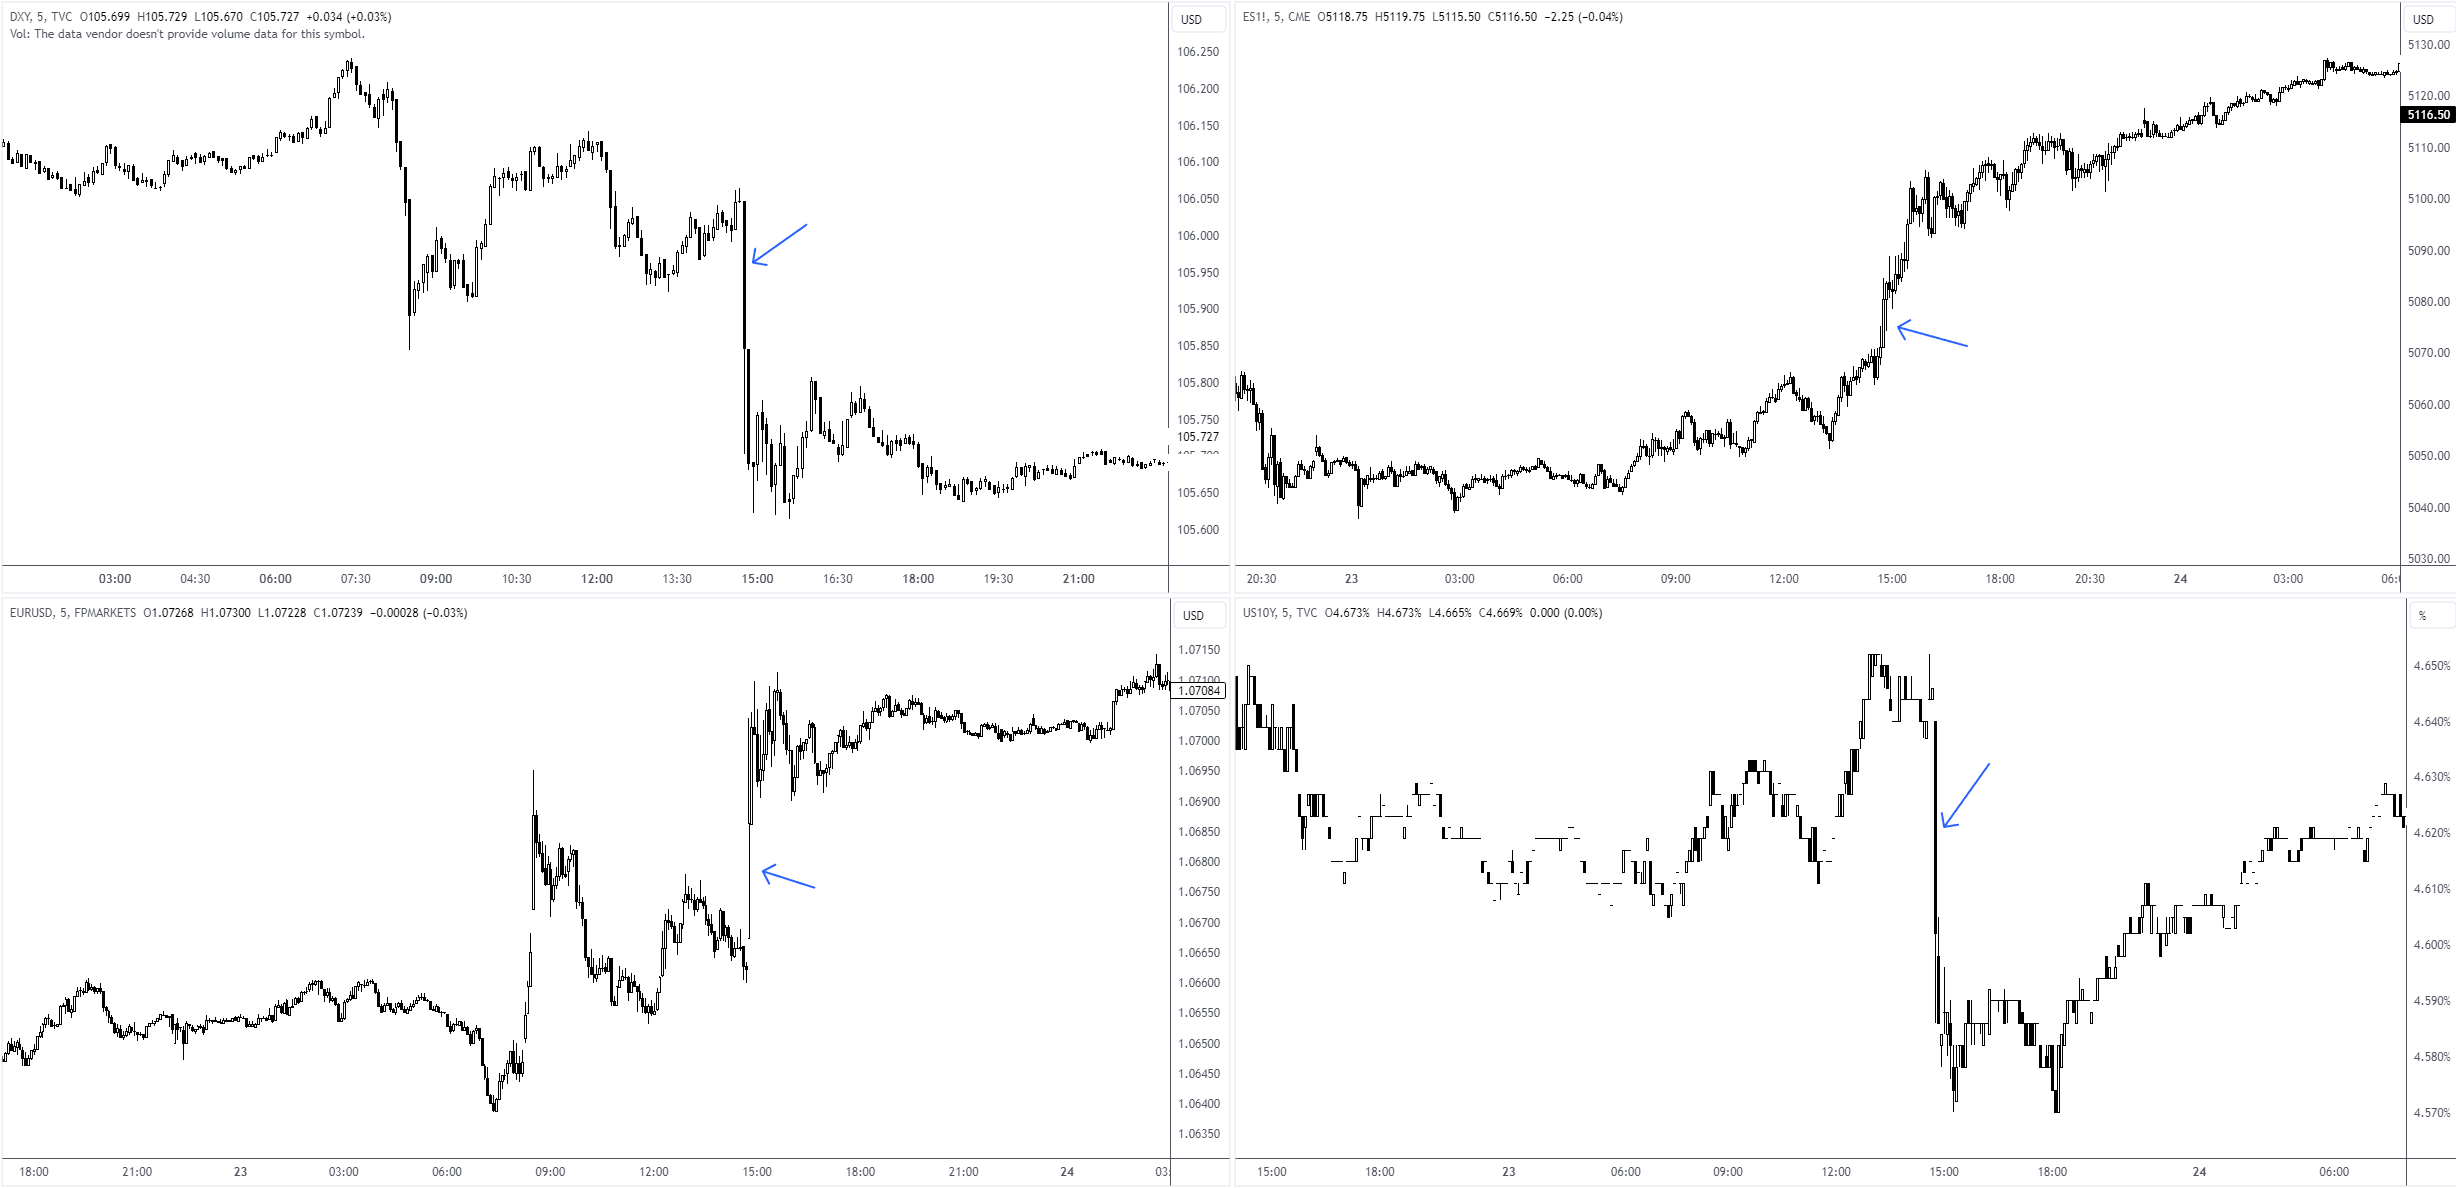
You will see notable market movement at times when there is a broad variance between expected values and actual prints that align with the central bank’s guidance. A good example of such was the recent US Flash PMIs (23 April 2024), which came in lower than expected across all three key indexes and triggered a sell-off in the US dollar, consequently underpinning currency pairs like the EUR/USD. This, as shown below, sent US equity indices higher, along with US Treasury bonds (yields lower). The move was immediate and, as you can see, felt through the financial markets.
Additional PMIs to Consider:
- The US releases a monthly PMI derived from the Institute for Supply Management (ISM). It is calculated similarly to the Global PMIs for the US manufacturing and services sectors.
- The Chicago PMI, which, as its title implies, focuses on the Chicago area in the US to gauge the health of the state's manufacturing and services sectors. This report is published by ISM-Chicago.
- Finally, there is a Global PMI, with many following the JP Morgan Global PMIs, prepared and distributed by S&P Global in association with ISM and the International Federation of Purchasing and Supply Management (IFPSM).
