

US Dollar Index:
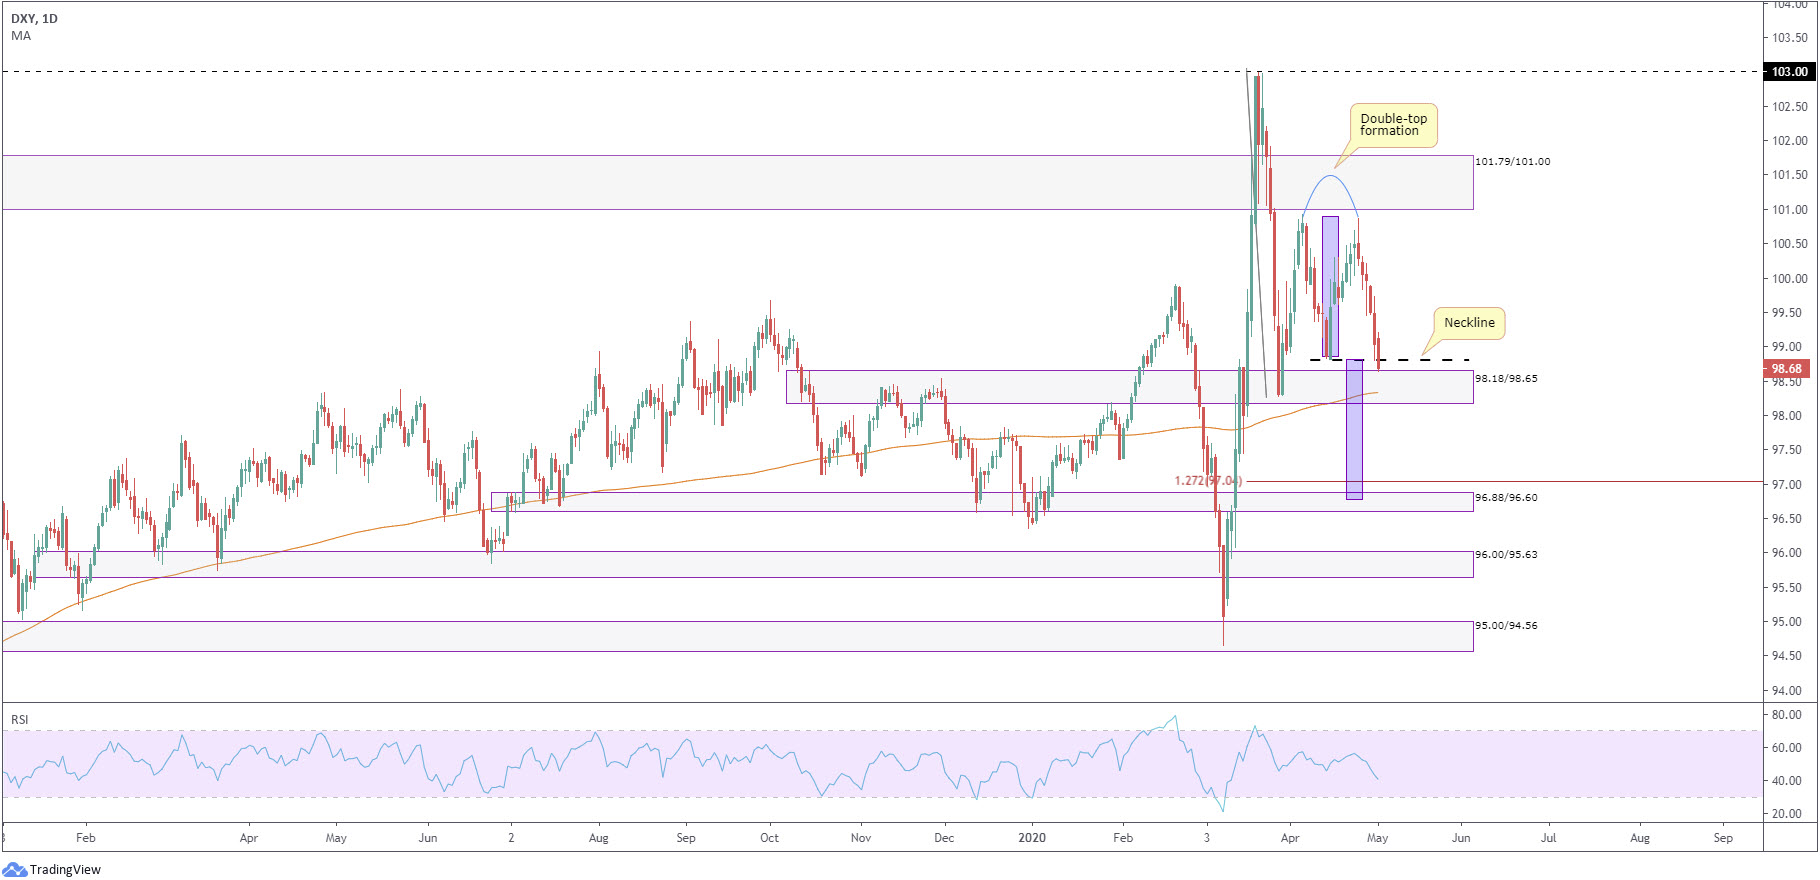
The US dollar index, or DXY, found thin air above 100.00 last week, finishing the session sub 99.00, lower by 1.60%.
Technical pattern traders will note the sprightly pullback pencilled in the final leg of a double-top scenario off 100.88, with Friday tunnelling through the neckline of the formation (98.82). Within the field of technical analysis, this is considered pattern confirmation – confirmation that we may be headed for demand at 96.88/96.60. The take-profit target (purple rectangles) is measured by taking the distance between the highest peak in the configuration to the pattern’s trough and adding this value to the breakout point (the neckline).
Yet, in order to reach 96.88/96.60, sellers must contend with demand found at 98.18/98.65, the 200-day simple moving average (SMA), currently circulating around 98.33, and a 127.2% Fib ext. level at 97.04.
In addition to the above, the RSI momentum indicator wrapped up the week closing beneath 50.00, suggesting a bearish vibe.
EUR/USD:
Monthly timeframe:
(Technical change on this timeframe is often limited though serves as guidance to potential longer-term moves)
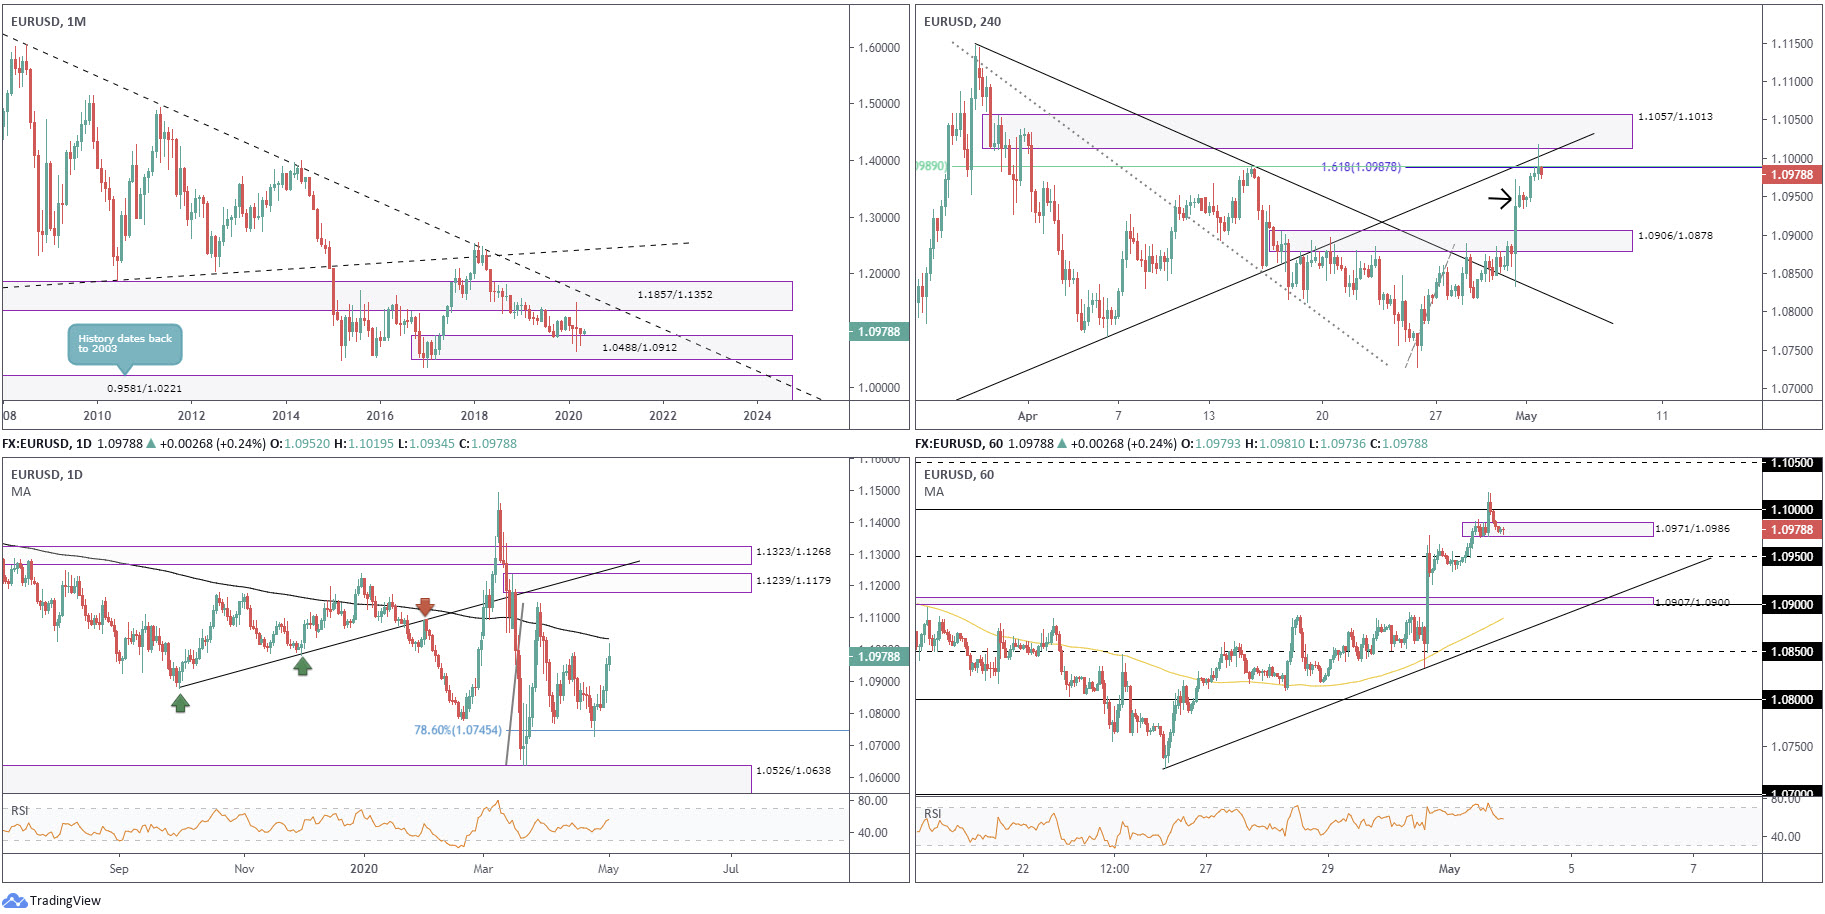
March, evident from the monthly chart, left behind a long-legged doji indecision candle, with its extremes crossing paths with heavyweight demand-turned supply at 1.1857/1.1352 (intersects with a long-term trendline resistance [0.6038]) and demand at 1.0488/1.0912.
April, as you can see, spent the best part of the month feasting on the top edge of 1.0488/1.0912, though did manage to squeeze out a Japanese hammer candlestick pattern, viewed as a bullish reversal candlestick signal.
With reference to the primary trend, price has exhibited clear lower peaks and troughs since 2008.
Daily timeframe:
Partially altered from previous analysis –
After a phase of foot-dragging, EUR/USD extended recovery gains off the 78.6% Fib level at 1.0745 into the week’s close.
Friday, as you can see, nudged through the April 15 high at 1.0990, unmasking the 200-day simple moving average (SMA) at 1.1034. Areas of relevance beyond the noted structures can be seen at the March 27 high from 1.1147 and supply at 1.1239/1.1179.
Indicator-based traders will also recognise the RSI indicator crossed above 50.00 into the closing stages of the week, indicating a bullish theme.
H4 timeframe:
Friday unearthed a reasonably well-presented Japanese shooting star candlestick pattern, viewed as a bearish reversal candlestick signal. Interestingly, the pattern formed off the lower boundary of supply at 1.1057/1.1013, joined with a trendline support-turned resistance (1.0635), a 61.8% Fib level at 1.0989 and a Fib ext. level from 1.0987.
Minor demand rests around 1.0950 (black arrow), with notable demand not expected to put in an appearance until 1.0906/1.0878, a supply-turned demand area.
H1 timeframe:
After taking a run at buy stops above the widely watched 1.10 level Friday, intraday flow reverted to a modest defensive play and tested demand at 1.0971/1.0986 at the tail end of the session. This demand, technically speaking, carries some weight, given it was likely the decision point to break above 1.10, meaning unfilled buy orders may be left within this region.
South of the aforesaid base, 1.0950 resides nearby, with a break of this level bringing to light a small supply-turned demand area at 1.0907/1.0900, the 1.09 handle, trendline support (1.0727) and a 100-period simple moving average (SMA).
With respect to the RSI, we also just exited overbought territory, fading peaks of 77.00.
Structures of Interest:
Long term:
The bullish candlestick signal formed out of monthly demand at 1.0488/1.0912 may eventually prompt a wave of buying. A daily close above the 200-day simple moving average (SMA) would serve as relatively strong confirmation we may be heading for higher levels longer term.
Short term:
H4 supply at 1.1057/1.1013, along with surrounding confluence (see above), suggests lower levels in the early stages of the week. Breaking through H1 demand at 1.0971/1.0986 could be enough to spark sellers. Conservative players, however, may want to see 1.0950 taken before considering intraday bearish scenarios.
AUD/USD:
Monthly timeframe:
(Technical change on this timeframe is often limited though serves as guidance to potential longer-term moves)
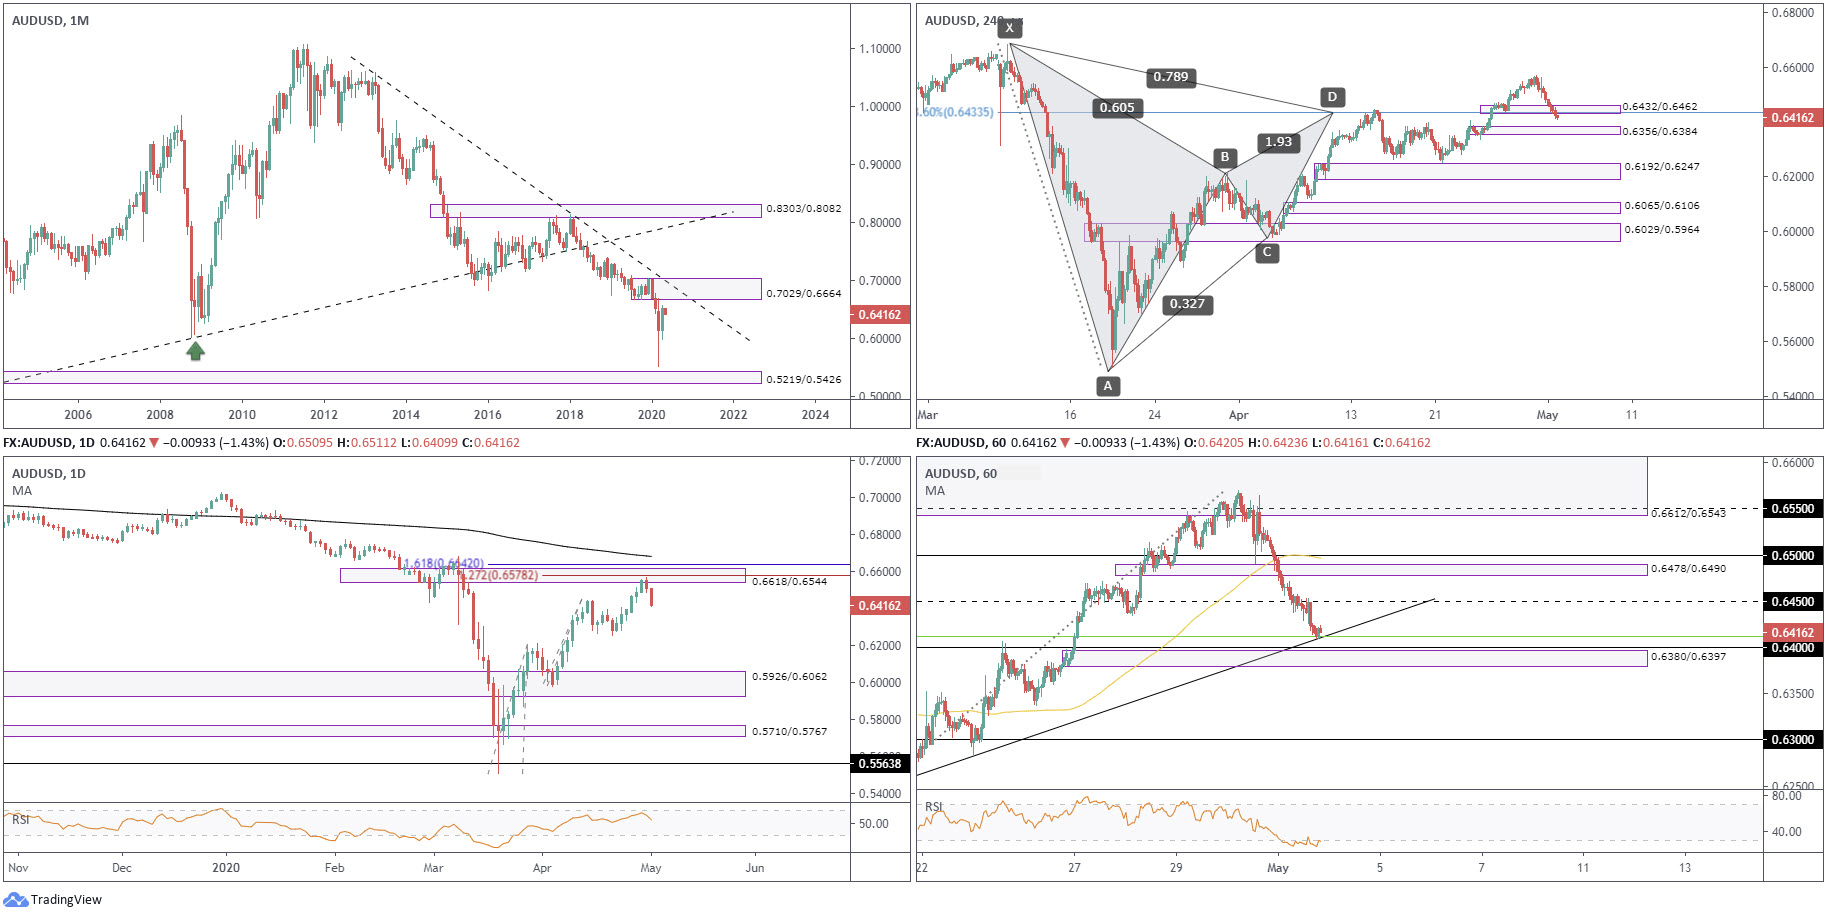
Overwhelmed by the effects of the coronavirus pandemic, the month of March scored seventeen-year lows at 0.5506 ahead of demand pencilled in from 0.5219/0.5426, before staging an impressive recovery.
The recovery move, alongside April’s 370-pip advance, landed the unit within striking distance of supply fixed at 0.7029/0.6664, intersecting with a long-term trendline resistance (1.0582).
With reference to the market’s primary trend, a downtrend has been present since mid-2011.
Daily timeframe:
Partially altered from previous analysis –
Following a dip to lows at 0.6253 on April 21, AUD/USD since regained a strong footing, chalking up six successive daily candles and carrying price into the walls of supply from 0.6618/0.6544. It should also be emphasised this area comes with a 127.2% Fib ext. level at 0.6578 and a nearby 161.8% Fib ext. level at 0.6642.
Thursday, as you can see, fashioned a bearish rotation candle out of the current supply, snapping the six-day winning streak, with Friday strongly extending losses by nearly 100 pips. Assuming continued interest to the downside, demand at 0.5926/0.6062 may come under attack.
H4 timeframe:
Partially altered from previous analysis –
The harmonic Gartley formation, boasting a defining limit at the 78.6% Fib level from 0.6433, continues to remain a focal point on the H4 timeframe. At the tail end of the week, fuelled (technically) on the back of selling from the current daily supply, price action leapt beneath H4 demand at 0.6432/0.6462. This is likely viewed as a sign sellers may be beginning to respect harmonic action.
The said harmonic pattern remains valid until breaking the X point at 0.6684. Traders will likely be watching for H4 demand at 0.6356/0.6384 to give way, with a subsequent run to demand at 0.6192/0.6247.
H1 timeframe:
AUD/USD found itself under significant pressure Friday, with the session addressing trendline support (0.6253) and a 50.0% ret level at 0.6412 (green). It must also be noted that a few pips beneath the said structure, demand is seen at 0.6380/0.6397, positioned close by the 0.64 level. 0.6450 stands as feasible resistance on the H1 timeframe, with subsequent moves targeting demand-turned supply at 0.6478/0.6490.
It might also interest some traders to note the RSI indicator is seen trekking through oversold terrain, and the 100-period simple moving average (SMA) shows signs of turning lower.
Structures of Interest:
Long term:
Monthly supply at 0.7029/0.6664 remains a point of interest to the upside, though in order to reach this far north traders must first contend with the noted daily resistances.
Short term:
Engulfing H4 demand at 0.6432/0.6462 is likely considered a strong sign sellers are beginning to show interest in the current H4 harmonic Gartley pattern.
H4 demand at 0.6356/0.6384 is also noteworthy, with H1 demand at 0.6380/0.6397 glued to the top of the noted H4 base.
Breaking through 0.6356/0.6384 adds weight to the downside and will likely see additional sellers enter the market in hope the Gartley formation sends prices lower. However, an intraday rebound from H1 demand at 0.6380/0.6397 should also not come as a surprise, owing to the round number 0.64 lurking close by as well as H4 confluence (demand).
USD/JPY:
Monthly timeframe:
(Technical change on this timeframe is often limited though serves as guidance to potential longer-term moves)
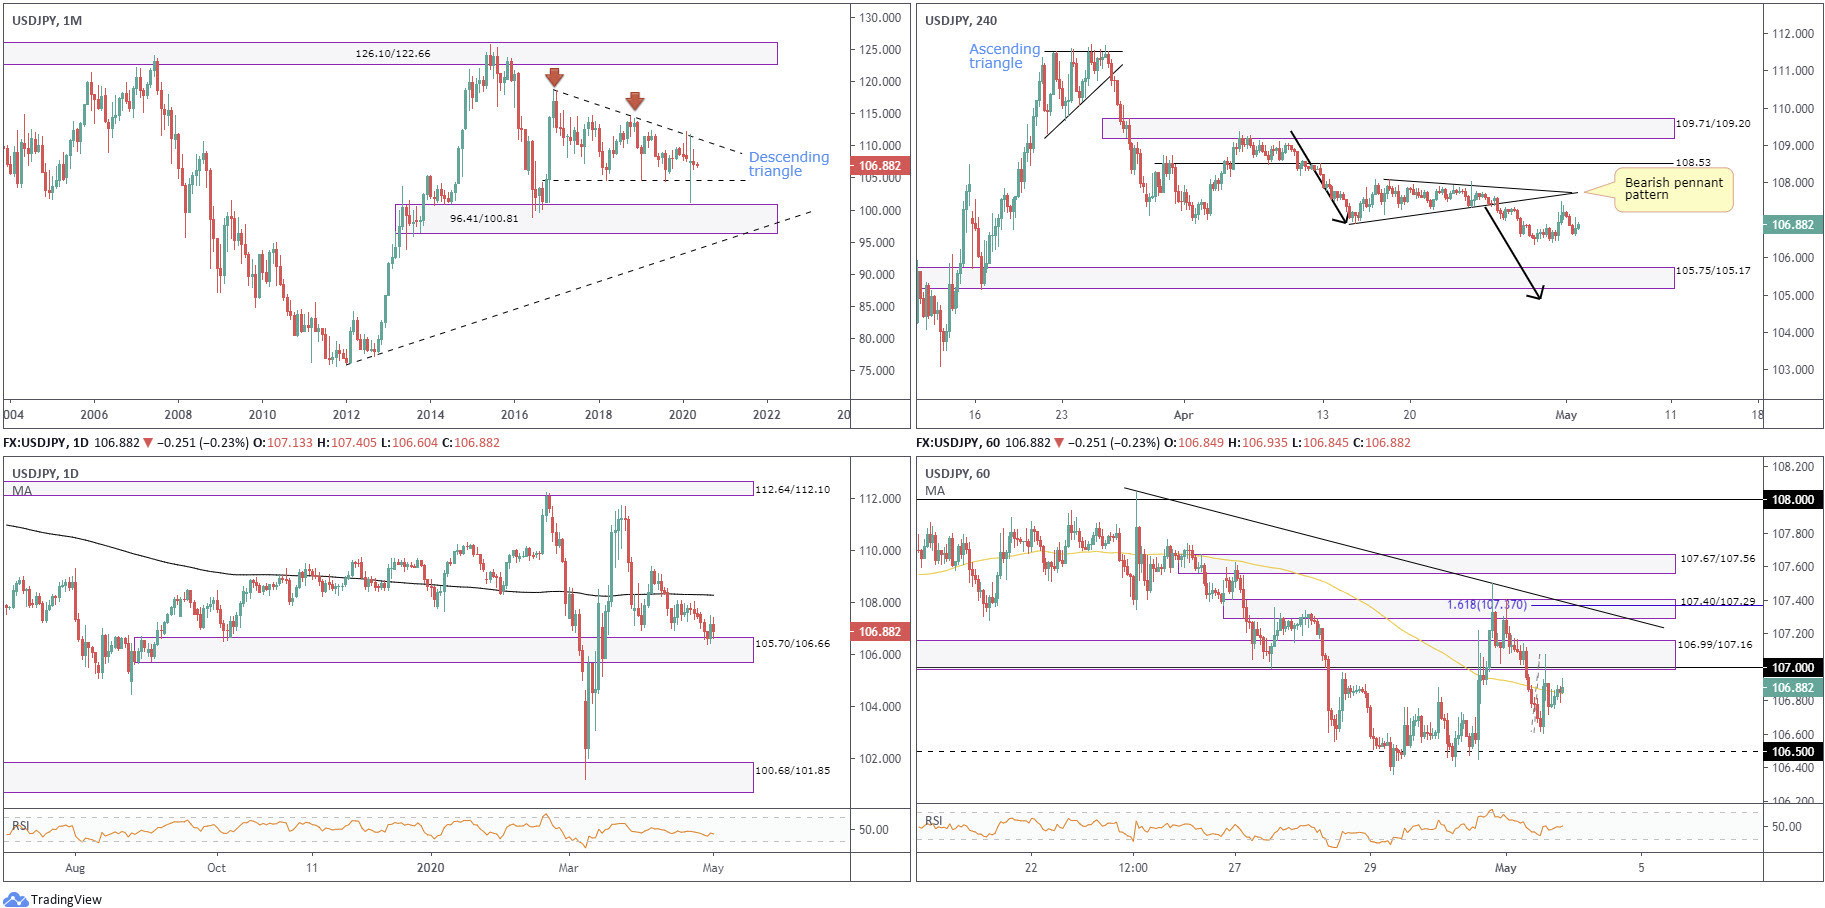
Since kicking off 2017, USD/JPY has been busy carving out a descending triangle pattern between 118.66/104.62. The month of March concluded by way of a long-legged doji candlestick pattern, ranging between 111.71/101.18, with extremes piercing the outer limits of the aforementioned descending triangle formation.
April was pretty uneventful, ranging between 109.38/106.35.
Areas outside of the noted pattern can be seen at supply from 126.10/122.66 and a demand coming in at 96.41/100.81.
Daily timeframe:
Partially altered from previous analysis –
Demand from 105.70/106.66 received price action last week after consolidating south of the 200-day simple moving average (SMA) at 108.28 since mid-April.
Thursday, as you can see, staged an impressive comeback from the aforesaid demand, snapping a six-day losing streak, though Friday fell flat with price action revisiting the said demand. Should the demand eventually abandon its position, we can look forward to demand plotted at 100.68/101.85 perhaps making an appearance.
H4 timeframe:
Partially altered from previous analysis –
A bearish pennant pattern between 106.92/108.07 took hold after having its lower boundary taken out at the beginning of the week. Despite a modest recovery on Thursday, downside remains the favoured route, according to chart studies.
Traditionally, take-profit targets out of bearish pennant patterns are formed by measuring the preceding move (109.38-106.92) and adding this value to the breakout point (black arrows – 104.89).
H1 timeframe:
Throughout European hours, Friday saw buyers take a back seat, overwhelming 107 and reaching lows at 106.60 into the US session, ten pips ahead of the 106.50 level. Price modestly pared losses, drawing the action back to 107 and a surrounding supply at 106.99/107.16.
An area that deserves notice on this timeframe is supply at 107.40/107.29, a base that aligns with a 161.8% Fib ext. level at 107.37 and a trendline resistance (108.04).
Structures of Interest:
Long term:
Price action on the monthly timeframe could essentially pop either way. The response out of daily demand at 105.70/106.66, however, echoes a fragile tone, therefore 100.68/101.85 could be brought to light this week.
Short term:
H4 price shows scope to navigate lower ground this week, possibly voyaging to demand at 105.75/105.17, followed by the bearish pennant take-profit target at 104.89. H1 flow could remain under 107 this week, approaching 106.50 and beyond; alternatively, a break to supply at 107.40/107.29 may also draw sellers into the fight.
GBP/USD:
Monthly timeframe:
(Technical change on this timeframe is often limited though serves as guidance to potential longer-term moves)
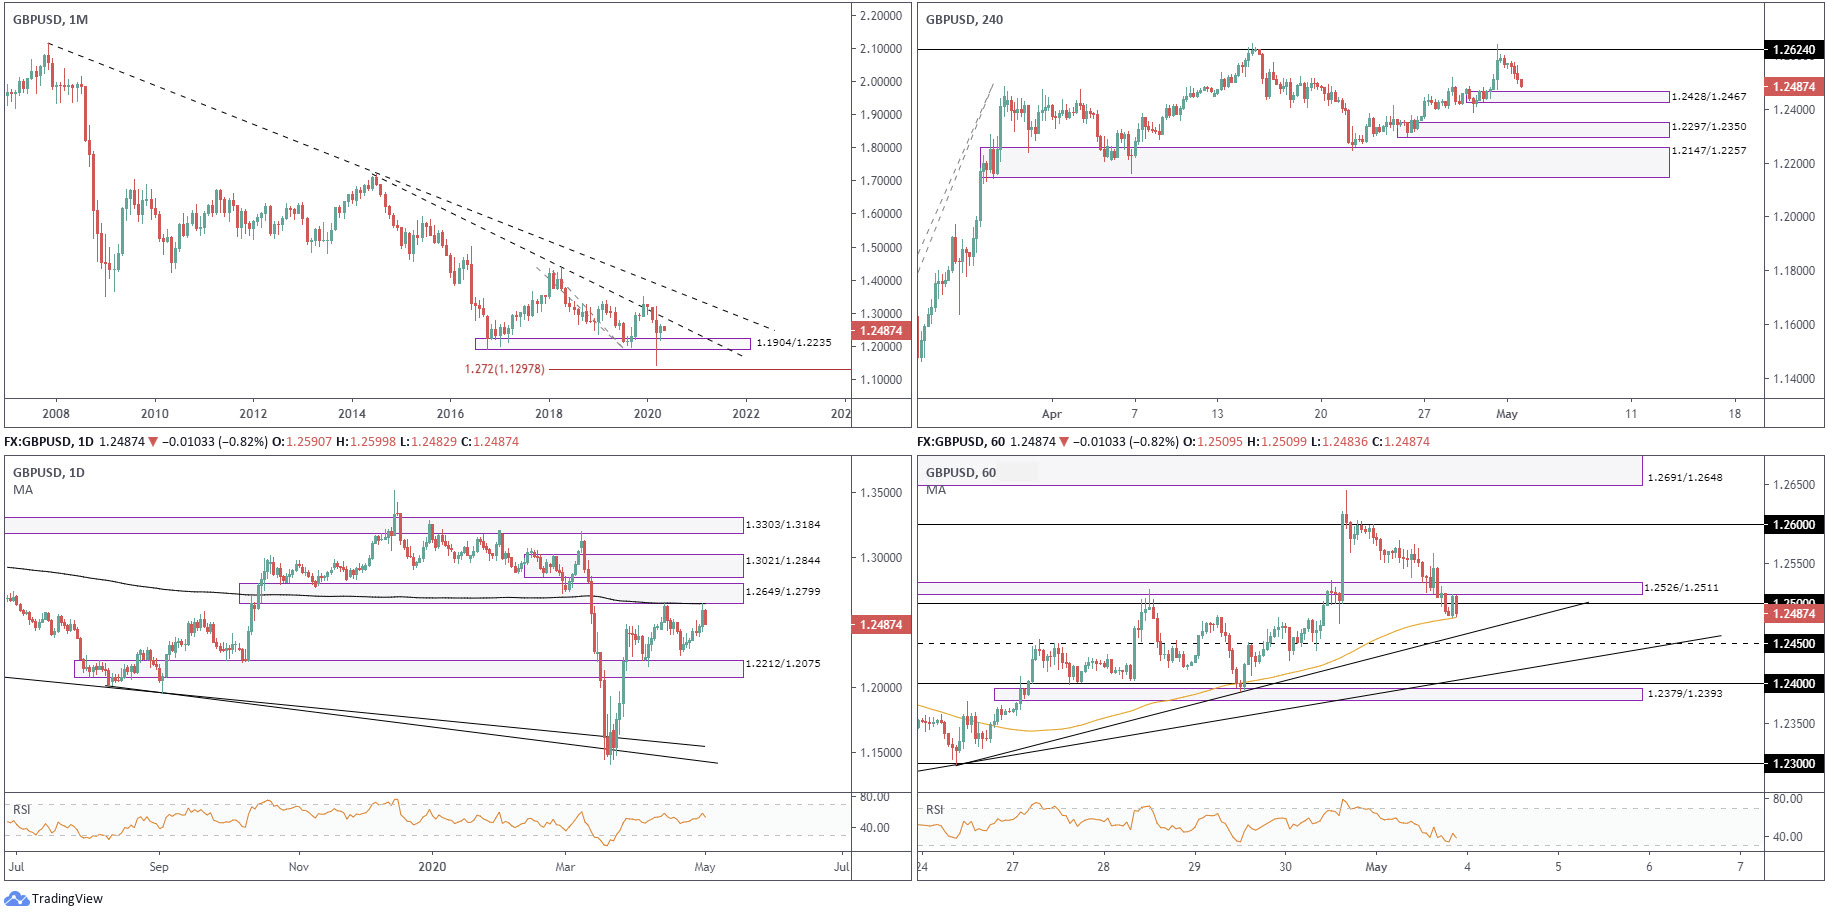
Although March clocked levels not seen since the 1980s, ahead of a 127.2% Fib ext. level at 1.1297, price staged an impressive recovery and regained approximately 80% of the month’s losses.
Support at 1.1904/1.2235 remains in play as we close out the month of April. Neighbouring resistance can be seen in the form of a trendline (1.7191).
Concerning the primary trend, lower peaks and troughs have decorated the monthly chart since early 2008.
Daily timeframe:
Partially altered from previous analysis –
Momentum diminished into the week’s close as the pair crossed paths with the 200-day simple moving average (SMA) at 1.2644, a value that boasts a close connection to a demand-turned supply at 1.2649/1.2799. Further selling could lead to demand at 1.2212/1.2075 entering play, whereas moves higher may whipsaw to supply at 1.3021/1.2844.
H4 timeframe:
Resistance at 1.2624 has contained upside since mid-March, with Friday fading the base and reaching lows at 1.2482. Demand at 1.2428/1.2467 is pictured close by, with a sustained move south of the base placing demand at 1.2297/1.2350 and 1.2147/1.2257 on the hit list.
We don’t really see much in the way of supply above the current resistance level; the next point of interest is made up of Fib studies, comprised of a 127.2% Fib ext. level at 1.2801 and a 78.6% Fib level at 1.2809.
H1 timeframe:
Despite a nudge to highs of 1.2642, a move that missed supply at 1.2691/1.2648 by a hair, price action established a solid position sub 1.26 Friday, eventually overthrowing supply-turned demand at 1.2526/1.2511 and 1.25 into the closing stages of the session.
The 100-period simple moving average (SMA), currently circulating around 1.2482, is in sight as potential support today, with a break uncovering trendline support (1.2298) and the 1.2450 level.
Structures of Interest:
Although daily price exhibits scope to press lower this week, room to manoeuvre beneath 1.25 on the H1 timeframe is somewhat cramped, along with H4 demand close by at 1.2467. Consequently, breakout sellers sub 1.25 may struggle.
With monthly price trading off 1.1904/1.2235, there’s a chance H4 price responds from demand at 1.2428/1.2467 this week. 1.2450/H1 trendline support on the H1, therefore, could be an area worth keeping an eye on in early trade.
DISCLAIMER:
The information contained in this material is intended for general advice only. It does not take into account your investment objectives, financial situation or particular needs. FP Markets has made every effort to ensure the accuracy of the information as at the date of publication. FP Markets does not give any warranty or representation as to the material. Examples included in this material are for illustrative purposes only. To the extent permitted by law, FP Markets and its employees shall not be liable for any loss or damage arising in any way (including by way of negligence) from or in connection with any information provided in or omitted from this material. Features of the FP Markets products including applicable fees and charges are outlined in the Product Disclosure Statements available from FP Markets website, www.fpmarkets.com and should be considered before deciding to deal in those products. Derivatives can be risky; losses can exceed your initial payment. FP Markets recommends that you seek independent advice. First Prudential Markets Pty Ltd trading as FP Markets ABN 16 112 600 281, Australian Financial Services License Number 286354.
